Download
1 / 15
150 likes | 159 Views
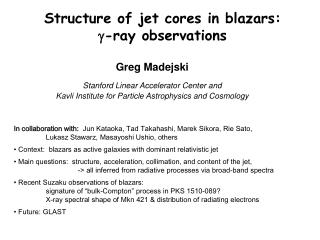
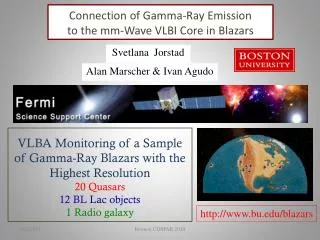
Structure of jet cores in blazars: g -ray observations. Greg Madejski Stanford Linear Accelerator Center and Kavli Institute for Particle Astrophysics and Cosmology. In collaboration with: Jun Kataoka, Tad Takahashi, Marek Sikora, Rie Sato, Lukasz Stawarz, Masayoshi Ushio, others

E N D
Structure of jet cores in blazars: g-ray observations Greg Madejski Stanford Linear Accelerator Center and Kavli Institute for Particle Astrophysics and Cosmology • In collaboration with: Jun Kataoka, Tad Takahashi, Marek Sikora, Rie Sato, • Lukasz Stawarz, Masayoshi Ushio, others • Context: blazars as active galaxies with dominant relativistic jet • Main questions: structure, acceleration, collimation, and content of the jet, • -> all inferred from radiative processes via broad-band spectra • Recent Suzaku observations of blazars: • signature of “bulk-Compton” process in PKS 1510-089? • X-ray spectral shape of Mkn 421 & distribution of radiating electrons • Future: GLAST
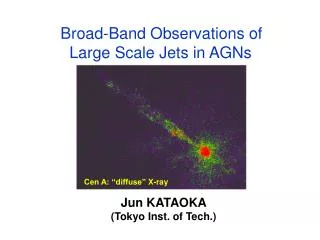
Context: extragalactic jets and their g-ray emission Mkn 421; data from Macomb et al. 1995 X-ray variability of Mkn 421 (Takahashi et al. 1996) • Jets are powered by accretion onto a massive black hole – the details of the energy conversion process • are still poorly known but g-rays often energetically dominant: blazar phenomenon • Gamma-ray emission often extends to the TeV region • All inferences hinge on the current ”standard model” – broad-band radiation is due to • the synchrotron & inverse Compton processes • We gradually are developing a better picture of the jet (content, location of the energy dissipation), but • how are the particles accelerated? Where? Protons or electrons? – are still open questions • Variability (simultaneous broad-band monitoring) can provide crucial information about the structure and • content of the innermost jet, relative power as compared to that dissipated via accretion, …
Another example: archetypal GeV blazar 3C279, ‘96 flare • Correlated variability on day time scales is common • Variable emission presumably arises in the innermost regions of the jet (but this is arguable…) • Variability in X-ray and g-ray bands puts constraints on the minimum relativistic boost (Gj) of the innermost region (via g-g absorption to e+/e- pair production) • Lorentz factors Gj of jets inferred from VLBI (multi-parsec scales) can be compared against Gj inferred from variability (sub-parsec scales) -> Gj as a function of distance from the black hole? - > constraints on acceleration process of the jet Data from Wehrle et al. 1998 Data from Jorstad et al. 2000
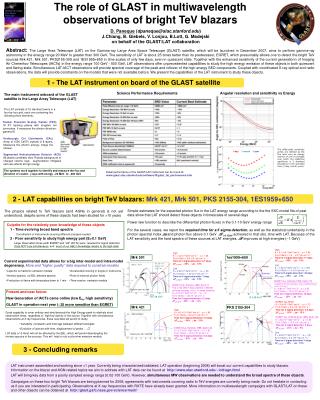
Suzaku observations of PKS 1510-089: hard power law + “soft excess” • Suzaku observed a number of blazars - the list includes many detected by EGRET and TeV observatories • Generally, the X-ray spectra of EGRET blazars are very hard power laws (energy indices often < 0.5), extending into the HXD PIN energy range (contrast to TeV blazars) • Very difficult to explain such hard spectra! • Interesting recent result is for PKS 1510-089, a blazar at z ~ 0.3 for 120 ks (joint observation of Jun Kataoka & GM; Kataoka+ 2008) • Spectrum is a hard power law (energy index a ~ 0.2), but with a soft X-ray “excess” below ~ 1.5 keV, best described as a steep power law or a thermal component with kT ~ 0.2 keV • Explanation as a “tail” of the synchrotron emission unlikely – extrapolation does not work • Too hot to be the tail of the “blue bump”
Suzaku observations of PKS 1510-089: possible evidence for “bulk-Compton” bump -> constraints on the jet content? • This soft excess might be the tentative evidence for the “Sikora bump” – arising by the inverse Compton scattering of BEL light by the cold electrons comoving in the relativistic jet (Ebump ~ E(Lya) x G2 ~ 1 keV) • Even if it is not “bulk-Compton”… • From its isotropic luminosity of LBC < 3 x 1044 erg/s - we can set a limit on the energy flux Le,cold carried by the cold electrons and the e+/e- pair content of the jet: • since LBC = (4sT/3mec2) UBEL rBLRGj3 Le,cold • we have • Le,cold • < 2.7x1043 (rBLR/0.1pc) (Gj/10)-3 (LBEL/1045erg/s)-1 erg/s • Significantly less than the required kinetic luminosity of the jet • Now the total power delivered by the jet • must be 8x1044 erg/s • With more realistic parameters, ne/np in the jet is < 5 • -> Jet contains more pairs than protons, but cannot be • dynamically dominated by e+/e- pairs • For details, see Kataoka+ 2008
65 60 55 50 45 40 35 XIS 0.6~10keV count/sec PIN 12~40keV 1.6 1.4 1.2 count/sec 1 0.8 0.6 0 10000 20000 30000 40000 50000 60000 70000 80000 (0day) (0.5day) (1day) time [sec] Another recent example: Mkn 421 observed with Suzaku Mrk 421 Ushio, GM, + 08 in preparation • * Broad-band X-ray spectrum measured by Suzaku cannot be described as a simple power law • Instead, the index steepens with increasing energy • Assuming constant B field, steepening electron distribution is implied • Best fitted with power-law electron distribution (index ~ 2.2), with super-exponential cutoff • (as inferred for some SNR; Tanaka et al. 2008) • Such a cutoff is predicted in, e.g., radiating relativistic electrons that were accelerated in turbulent B field • (see, e.g., Stawarz and Petrosian 2008) • Applicable to many blazars where the X-ray band represents the high-energy tail of the synchrotron peak • (often the “TeV blazars”) 6
EGRET All Sky Map (>100 MeV): precursor to GLAST 3C279 Cygnus Region Vela Geminga Crab PKS 0528+134 LMC Cosmic Ray Interactions With ISM PSR B1706-44 PKS 0208-512
Rocket Fairing installation around GLAST
GLAST Launch • Launch from Cape Canaveral Air Station 11 June 2008 at 16:05PM UTC • Circular orbit, 565 km altitude (96 min period), 25.6 deg inclination. • Communications: • Science data link via TDRSS
GLAST is in orbit! Schematic principle of operation of the GLAST Large Area Telescope * g-rays interact with the hi-z material in the foils, pair-produce, and are tracked with silicon strip detectors * The instrument “looks” simultaneously into ~ 2 steradians of the sky * Energy range is ~ 0.03-300 GeV, with the peak effective area of ~ 12,000 cm2 - allows an overlap with TeV observatories Why SLAC? clear synergy with particle physics: - particle-detector-like tracker/calorimeter - potential of discovery of dark matter particle
100 s 1 orbit 1 day 3EG limit 0.01 0.001 LAT 1 yr 2.3 10-9 cm-2 s-1 GLAST observing strategy & performance: angular resolution, broad-band sensitivity (1 year)
Engineering Data: Single Events in the LAT The green crosses show the detected positions of the charged particles, the blue lines show the reconstructed track trajectories, and the yellow line shows the candidate gamma-ray estimated direction. The red crosses show the detected energy depositions in the calorimeter.
GLAST LAT has much higher sensitivity to weak sources, with much better angular resolution EGRET GLAST
Example of flaring activity of blazars:Recent outburst of 3C454.3 Objects subject to intensive monitoring (=GLAST LAT g-ray flux history will be available, no special repointing): 3C273 NRAO 530 3C279 1ES1959+65 PKS 0528+134 OJ 287 3C454.3 0716+714 PKS 1510-089 PKS 2155-304 Mkn 421 PKS 0208-512 BL Lacertae 0836+714 PKS1622-297 Mkn 501 1406-076 1426+428 W Com (1219+285) … http:/glast.gsfc.nasa.gov/ssc/data/policy GLAST flux limit for reporting of “major flares”: 2 x 10⁻⁶ photons/cm2/s (E>100 MeV)
Clusters of galaxies with GLAST and NuSTAR From Markevitch et al. (X-ray data: 2004, 2005); Clowe et al. NuSTAR schematic: SMEX; (lensing data: 2004), and Bradac et al. 2006 (S+W lensing) sensitive hard X-ray (10-80 keV) telescope system; launch 2011-2012 What are details of formaton of clusters? Non-thermal processes? Jet-cluster interaction? Best studied in hard X-rays or g-rays: inverse Compton of CMB or thermal X-ray photons against cluster’s relativistic particles