Download
1 / 23
230 likes | 383 Views
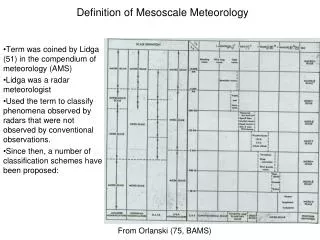
The Environment of Warm Season Elevated Thunderstorms Associated with Heavy Rainfall Over the Central United States by: James T. Moore, Fred H. Glass, Charles E. Graves, Scott M. Rochette , and Marc J. Singer. AnneMarie Giannandrea ESC 452 Mesoscale Meteorology 4/22/10. Background.

E N D
The Environment of Warm Season Elevated Thunderstorms Associated with Heavy Rainfall Over the Central United Statesby: James T. Moore, Fred H. Glass, Charles E. Graves, Scott M. Rochette, and Marc J. Singer AnneMarieGiannandrea ESC 452 Mesoscale Meteorology 4/22/10
Introduction MCS rain accounts for 30-70% of the Central United States growing season rainfall They also lead to flash flooding and property destruction. Study was produced “the focus of this study is to quantify the synoptic–meso-α-scale environment and physical processes favorable for the production of organized elevated thunderstorms (i.e., MCSs) that produce copious rainfall.” (Moore, et.al, 2003)
Definitions Composite Study: Study which attempts to look at representative cases of a phenomenon and discern the common characteristics of that phenomenon. Elevated Convection: Convection occurring within an elevated layer, i.e., a layer in which the lowest portion is based above the earth's surface. Elevated convection often occurs when air near the ground is relatively cool and stable, e.g., during periods of isentropic lift, when an unstable layer of air is present aloft. In cases of elevated convection, stability indices based on near-surface measurements (such as the lifted index) typically will underestimate the amount of instability present. Severe weather is possible from elevated convection, but is less likely than it is with surface-based convection. (From http://www.crh.noaa.gov/glossary.php?letter=e)
What Creates Elevated Convection? From Coleman, 1990
Previous Research Coleman defined the elevated thunderstorm and MCS in his papers in the 1990s More recently, there has been an attempt at using a composite approach to determine the characteristics of these storms.
Dataset Storms must have produced at least 10 cm of rain, and have been ongoing within 4 hours of either the 00Z or the 12Z sounding A total of 21 events were identified, covering 35 sounding periods.
Method Satellite imagery was used to determine the existence of the MCS in the window around 0000Z and 1200Z Plots were generated and used to determine whether or not the MCS was elevated Rawinsonde data was processed using documented schemes, and derived parameters were output. They were plotted on grids centered around the respective MCS centroid. Centroids were determined by the highest reflectivities or coldest cloud tops, if radar data was unavailable.
Surface and Kinematic Upper Air Fields • Surface: • The surface boundary is oriented west to east, 160 km South of the MCS Centroid • The centroid is located in the θe gradient, to the east of a ridge axis. • 925 hPa: • West- east baroclinic zone of moderate strength • The centroid is located 600 km downstream of the wind max. • Located north of the max. moisture convergence • 850 hPa: • Baroclinic zone is farther north • Heaviest rain is located in the left exit region of the southwesterly wind maximum • The wind maximum is approximately 400 km upstream of the MCS centroid. • Large region of θe advection close to the centroid. • Moisture convergence values at 850 hPa (0.8 g (kg h)-1) • Region of positive thermal advection (about 0.4 C h-1)
Surface and Kinematic Upper Air Fields • 700 hPa • Similar to 850 hPa in distances, but weaker in magnitudes • 500 hPa • A weak short wave trough in the height and vorticity fields is found approximately 100 km upstream. • Continued veering of winds • Midlevel jet axis found west of the centroid. • 250 hPa • Anticylclonically curved jet streak ( approximately 80 kts) well to the northeast • The centroid is within a divergence maximum.
Stability and Moisture Fields • Stability • The mean LI is around 4 C at the MCS centroid, and the Showalter index is similar • The mean surface CAPE is overwhelmed by the mean surface CIN (110 J kg-1) • The max θeCAPE values are on the order of 1250 J kg-1 at the centroid, and it lies within a max θeCIN valley
Stability and Moisture Fields • Moisture: • Precipitable water values range from 1.2 to 1.3 inches at the centroid, with higher values to the south • The Mean Relative Humidity (MERH) has values greater than 70% at the centroid, and a distribution that mirrors the shape of the MCS.
Vertical Profiles of Wind Shear and Instability Composite soundings were constructed for both the MCS centroid and an inflow point sufficiently far to the south. At the centroid, the near surface wind is from the east-southeast at about 2.5 ms-1 and veers to the southwest at about 10 ms-1 at 850 hPa. Above 850 hPa, the winds gradually increase in speed to 25 ms-1 at 300 hPa, with little directional change. At the inflow site, the near-surface winds are from the south at 2 ms-1 and veer to the southwest at 15 ms-1 at 800 hPa.
Vertical Profiles of Wind Shear and Instability The centroid has a convectively stable boundary layer with a 150 hPa (800-650 hPa) unstable layer. The inflow site has a shallow layer of convectively stable air, and a 350 hPa (950-600 hPa) layer of unstable air above it.
Representativeness The 15 of the 21 cases were recomputed to remove the environmental modification the occurs in mature MCSs When the fields were recomputed, in most cases the magnitudes were different, but the spatial distribution was the same. Basic parameters had high correlation coefficient, derived parameters were less well correlated. In about 50% of the cases at least 10 out of the 18 parameters studied were above the median correlation coefficient for the respective parameter.
Cross-sectional View Schematic cross-sectional view taken parallel to the LLJ across the frontal zone. Dashed lines represent typical θevalues, the large stippled arrow represents the ascending LLJ, the thin dotted oval represents the ageostrophic direct thermal circulation associated with the upper-level jet streak, and the thick dashed oval represents the direct thermal circulation associated with the low-level frontogenetical forcing. The area aloft enclosed by dotted lines indicates upper-level divergence; the area aloft enclosed by solid lines denotes location of upper-level jet streak. Note that in this cross section the horizontal distance between the MCS and the location of the upper-level jet maximum is not to scale.
Plan View Schematic diagrams that summarize the typical conditions associated with warmseason elevated thunderstorms attended by heavy rainfall: (a) low-level plan view and (b) middle– upper-level plan view. In (a), dashed lines are representative θevalues decreasing to the north, dashed–cross lines represent 925–850-hPa moisture convergence maxima, the shaded area is a region of maximum θeadvection, the broad stippled arrow denotes the LLJ, the encircled Xrepresents the MCS centroid location, and the front is indicated using standard notation. In (b), dashed lines are isotachs associated with the upper-level jet, solid lines are representative height lines at 500 hPa, the stippled arrow denotes the 700-hPa jet, and the shaded area indicates where the mean surface-to-500-hPa relative humidity exceeds 70%.
Conclusions The applicability of these results to other parts of the United States has not been established. Although quantifying the significant parameters used to diagnose a favorable region of elevated convection leading to heavy rain is important, it is equally as important to note the spatial distribution of these variables. In this way a conceptual model can be constructed that depicts how critical physical processes synergistically interact to create a mesoscale environment favorable for the development of elevated thunderstorms. (Moore, et. al., 2003)
Works Cited Colman, B. R., 1990a: Thunderstorms above frontal surfaces in environments without positive CAPE. Part I: A climatology. Mon. Wea. Rev., 118, 1103–1121. Moore, et. al., 2003: The Environment of Warm Season Elevated Thunderstorms Associated with Heavy Rainfall over the Central United States. Weather and Forecasting, 18, 861-878.