Download

1 / 26
260 likes | 383 Views
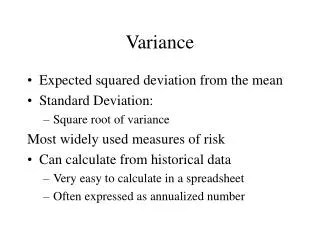
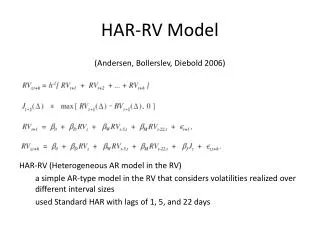
HAR-RV with Sector Variance. Sharon Lee April 1, 2009. HAR-RV Model. HAR-RV makes use of average realized variance over daily, weekly, and monthly periods. h=1 corresponds to daily periods, h=5 corresponds to weekly periods, h=22 corresponds to monthly periods

E N D
HAR-RV with Sector Variance Sharon Lee April 1, 2009
HAR-RV Model • HAR-RV makes use of average realized variance over daily, weekly, and monthly periods. • h=1 corresponds to daily periods, h=5 corresponds to weekly periods, h=22 corresponds to monthly periods • These time horizons correspond to day-ahead, 5-day ahead, and month-ahead predictions of average realized variance.
Sectors • Consumer Goods • Healthcare • Financial • Technology • Basic Materials • Industrials • Utilities • Conglomerates • Services • Stocks with less than 2000 observations were removed
HAR-RV Models • 1) Single stock on stock’s regressors • 2) Single stock on stock’s regressors and its sector’s regressors • 3) Single stock on stock’s regressors, sector’s regressors, and market’s regressors
Consumer Goods Sector Model Fits
Healthcare Model Fits
Financial Model Fits
Technology Model Fits
Basic Materials Model Fits
Conglomerates Model Fits
Industrial Model Fits
Services Model Fits
Utilities Model Fits
Utilities Model Fits
next • Explanations for market variables • R-squared patterns among sectors • Incorporate risk factors • Further analysis