Download
1 / 17
170 likes | 330 Views
Estimation of DEB parameters. Bas Kooijman Dept theoretical biology Vrije Universiteit Amsterdam Bas@bio.vu.nl http://www.bio.vu.nl/thb /. Nantes, 2007/04/24. Auxiliary theory. Quantities that are easy to measure (e.g. respiration, body weight) have contributions form several processes

E N D
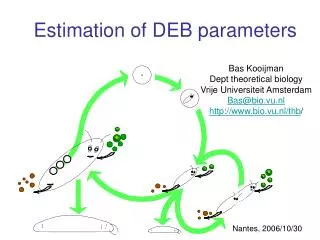
Estimation of DEB parameters Bas Kooijman Dept theoretical biology Vrije Universiteit Amsterdam Bas@bio.vu.nl http://www.bio.vu.nl/thb/ Nantes, 2007/04/24
Auxiliary theory Quantities that are easy to measure (e.g. respiration, body weight) have contributions form several processes they are not suitable as variables in explenatory models Variables in explenatory models are not directly measurable we need auxiliary theory to link core theory to measurements Standard DEB model: isomorph with 1 reserve & 1 structure that feeds on 1 type of food
DEB parameters • primary parameters determine • food uptake • changes of state variables (reserve, maturity, structure) • compound parameters: functions of primary parameters • composition parameters • food, reserve, structure, products (feaces, N-waste) • thermodynamic parameters • free energies (chemical potentials) • entropies • dissipating heat
Reserve & maturity: hidden Maturity: information, not mass or energy quantified as cumulated mass of reserve that is invested Scale reserve & maturity
Growth at constant food 3.7 length, mm Von Bert growth rate -1, d time, d ultimate length, mm Von Bertalanffy growth curve: time Length L. at birth ultimate L. von Bert growth rate energy conductance maint. rate coefficient shape coefficient
measured quantities primary pars Standard DEB model (isomorph, 1 reserve, 1 structure) reserve & maturity: hidden variables measured for 2 food levels primaryparameters
Two-sample case: D. magna 20°C Optimality of life history parameters?
Primary thermodynamic pars • Given primary parameters: • get composition parameters • get mass fluxes (respiration) • get entropies, free energies
Reserve vs structure structure carbohydrate lipid cumulative fraction reserve Kcal/g wet weight protein time, d time of reserve depletion, d Body mass in starving pacific oyster Crassooestrea gigas at 10°C Data from Whyte J.N.C., Englar J.R. & Carswell (1990). Aquaculture 90: 157-172.
Food density from reprod data • Data from Stella Berger, univ München, on Daphnia hyalina • Observed in enclosure (1 haul per week): • length of individuals • # eggs in brood pouch • length, width of an egg: test of maternal effects fdaughter(birth) = fmother(egg laying) • “Given” par values derived from Daphnia magna = 0.8; v = 3.24 mm d-1; kJ = 1.7 d-1; kM = 1.7 d-1; g = 0.69; UHb = 0.0046 d mm2; UHp = 0.042 d mm2 • Reconstruction: • one scaled functional response per individual • one scaled functional response per haul • Observation: • min egg volume = 16 max egg volume volume increases
Food density from reprod data Reconstruction basis:
1-18 1-19 1-17 1-21 N 2-16 2-17 2-18 1-23 N 2-19 2_20 2-21 2-22 N 3-17 3-19 3-20 3-21 N L L L L
3-25 4-16 3-23 4-17 N 4-19 4-20 4-21 4-18 N L 4-22 4-24 4-25 N L L L N: # eggs in brood pouch L: body length f : single estimated parameter per graph
Food density from reprod data food different for each ind food the same for ind in one haul initial egg volume, mm3 f f scaled functional resp, f week week