Download
1 / 31
310 likes | 454 Views
The Resurgent American Voter, 1988-2008. Michael D. Martinez Department of Political Science University of Florida P.O. Box 117325 Gainesville, Florida 32611-7325 USA martinez@ufl.edu. A Depressing Bookshelf. Voter turnout calculation.

E N D
The Resurgent American Voter, 1988-2008 Michael D. Martinez Department of Political Science University of Florida P.O. Box 117325 Gainesville, Florida 32611-7325 USA martinez@ufl.edu
Figure 1: Presidential Election Turnout Rates, 1948-1996 Source: 1948-1976 (McDonald and Popkin 2001, 966); 1980-1996 (McDonald 2009)
Explanations of Turnout Decline • Decline of Partisanship • Abramson and Aldrich, APSR 1982; Shaffer, AJPS 1981 • But see Cassel and Luskin APSR 1988, Teixiera 1992 • Newspaper reading • Teixiera, 1992 • Decline in Mobilization • Rosenstone and Hansen, 1993
Explanations of Turnout Decline • Decline of Partisanship • Abramson and Aldrich, APSR 1982; Shaffer, AJPS 1981 • But see Cassel and Luskin APSR 1988, Teixiera 1992 • Newspaper reading • Teixiera, 1992 • Decline in Mobilization • Rosenstone and Hansen, 1993
Figure 2: VEP Presidential Election Turnout Rates, 1948-2008 Source: 1948-1976 (McDonald and Popkin 2001, 966); 1980-2008 (McDonald 2009)
Main Questions for the Paper • Why has turnout increased in recent elections? • Do the same explanations that account for the decline in turnout also account for the recent increase?
Approach and Data • Two necessary conditions • Any factor that would be a partial cause of the increase in turnout • must be correlated with voter turnout • must have changed in the direction associated with greater voter turnout over the period of interest • Longitudinal Data that include measures of interest • American National Election Studies • Cumulative file, 1988-2004, merged with ANES 2008
Data adjustments • Survey “turnout” rates are higher than actual turnout rates • “Overreporting” • Silver et al. APSR 1986; Karp and BrockingtonJOP 2005 • Panel effects (attrition and conditioning) • Bartels Political Analysis 2000 • Non-random sampling error • BrehmPhantom Respondents 1993 • Burden Political Analysis 2000 • Secondary weights to adjust for actual turnout rate
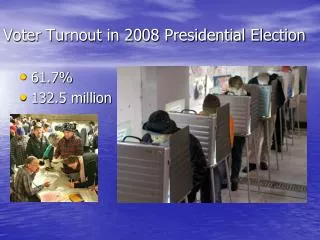
Data adjustments • Secondary weights to adjust for actual turnout rate • Weight = ANES Post-weight * (VEP est./ Survey est.) • For reported voters in 2008 • Weight = ANES Post-weight * (61.7 / 77.4) • For reported nonvoters in 2008 • Weight = ANES Post-weight * (38.3 / 22.6)
Data adjustments • Secondary weights to adjust for actual turnout rate • Changes in question wording • In some cases, recoding categories can approximate comparability • Church attendance • In other cases, changes in question wording make comparisons over time suspect
Data adjustments • Secondary weights to adjust for actual turnout rate • Changes in question wording • Imputation of missing data
Brody’s (1978) Puzzle of Participation • Voting was getting easier in late ’60s and early ’70s • Turnout Increased in the South (Stanley 1987) • But not in the non-South • “[T]he demographic changes in the electorate, to the extent they relate to turnout, on balance would lead us to expect higher rather than lower rates of participation.” (Brody 1978, 299) • Turnout decline persisted from 1960 to 1988 in the face of continuing changes in demography that should have been correlated with higher turnout. • (Rosenstone and Hansen 1993; Teixeira 1992)
Model Estimation • Estimate a logit model of turnout • Pooled time-series with year fixed effects • y = e(b0 + b1 Y92 + b2 Y96 + b3Y00 + b4Y04 +b5Y08+bnXn) • Recall that in the multivariate analyses, the coefficients for each year dummy reflects the unexplained difference in the probability that a person would have voted in each year relative to 1988, controlling for other variables in the model.
Table 2: Effects of Education and Year Dummies on Turnout, 1988-2008
Simulating Turnout • In order to obtain the estimated hypothetical turnout in 1988 under the modeled conditions present in 2008 … • [1] Subtract the coefficient for the 2008 year dummy from the predicted (linear) value for each case in that year (XB). • [2] Convert those values into probabilities using the logit function (p = e XB / (1 + eXB)). • [3] The weighted sum of those probabilities is the estimated 1988 turnout under the conditions present in 2008.
Table 2: Effects of Education and other Demographic Variables on Turnout, 1988-2008
Table 4: Effects of Partisanship, Closeness, and Education on Turnout, 1988-2008
Table 6: Effects of Contacting and Education on Turnout, 1988-2008
Table 8: Effects of State Laws and Education on Turnout, 1988-2008
Discussion: Summary • Turnout has increased rather dramatically in last three US Presidential Elections • Tools for analyzing the sources of that increase are still available • Don’t take ANES for granted; no study in 2006 • Education explains much of the increase • But not the earlier decline • Contacting also explains a substantial portion of the increase • Underscoring robustness of Rosenstone and Hansen’s explanation of the decline
Discussion: Future research • Verify demographic findings with CPS data • Non-presidential elections • Does increased turnout affect election outcomes, patterns of representation, and public policy?
Thanks for listening! I’d appreciate your comments.