Download
1 / 41
410 likes | 417 Views
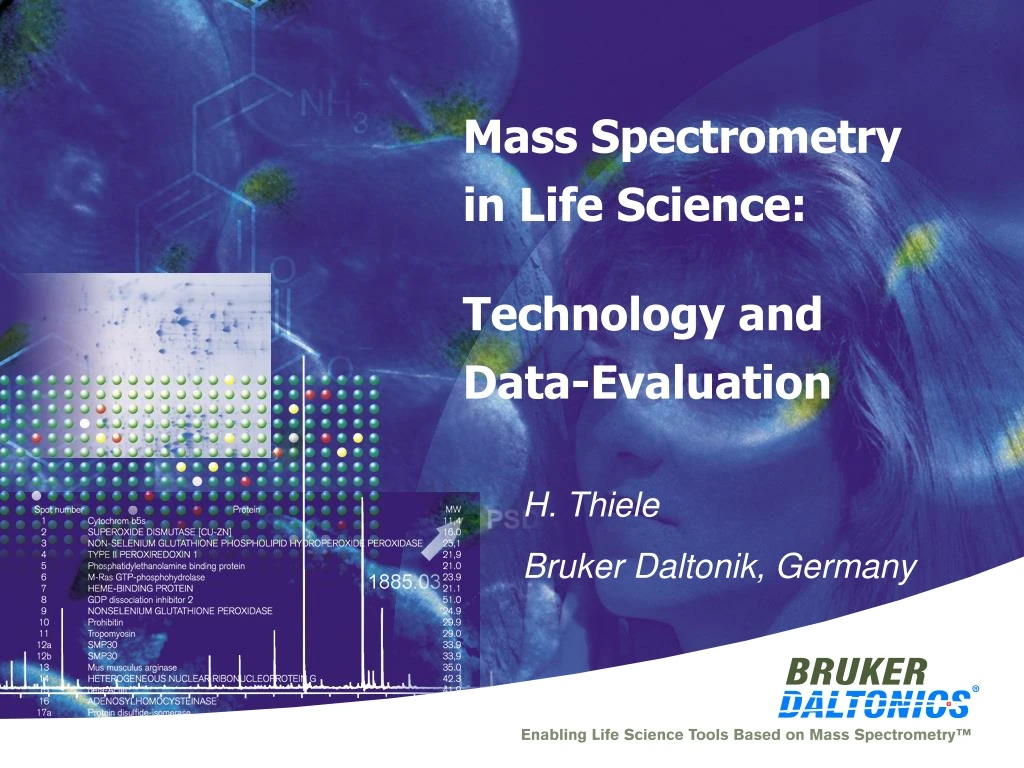
Mass Spectrometry in Life Science: Technology and Data-Evaluation. H. Thiele Bruker Daltonik, Germany. Functional Genomics. Bridging Proteomics & Genomics. Proteomics. Genomics. MALDI-TOF Mass Spectrometry. Proteome Analysis Investigation of protein diversity.

E N D
Mass Spectrometry in Life Science: Technology and Data-Evaluation H. Thiele Bruker Daltonik, Germany
Functional Genomics Bridging Proteomics & Genomics Proteomics Genomics MALDI-TOF Mass Spectrometry Proteome Analysis Investigation of protein diversity SNP Genotyping Search for genetic variations Identification No a priori knowledgeabout analyte Screening Analyte of known MW MALDI-TOF MS
The Technology • Mass Spectrometer • for • Biopolymer Research
Analyte molecules in matrix Principle of MALDI-TOF-MS Vacuumlock • all ions with Ekin = 1/2mv2 Laser Vacuum system Linear flight tube Drift region Ion detector Sampleplate Acceleration grids Mass spectrum space/energy uncertainty 20 to 200 spectra have to be added;total duration 2 to 20 secondswith 50 (200) Hertz Laser Flight time m/z
Laser High resolution TOF-MS with Reflector 0V + kV MALDI ionsource Ion reflector Iondetector HiRes mass spectrum The reflector focuses ions of same mass but different Ekin (velocity) on detector; high resolution is obtained m/z Flight time
MS/MS by PSD • MS/MS = fragment ion or tandem mass spectromentry • PSD = Post Source Decay
PSD by Reflectron TOF (Scheme) Metastable decay of molecular ions, energy is reduced according to mass ratio Adjustment of voltages Electr. potentialion energy Segment 1 Segment 2 Segment 3 Segment 4 E = 1/2 mv2 v=const. eg. if M+ = 1000, m = 500 has 4 keV m = 100 has 0.8 keV m =25 has 100 eV Source Reflector
Weaker field Weak field Weaker field Strong field Laser TOF-MS/MS by PSD Manual operation: 20 – 40 minutes;automatic operation: 5 – 10 minutesper daughter ion spectrum(100 acquisitions in each segment) Adjustment of voltages Adjustment of voltages Adjustment of voltages MALDI ionsource Parent ionselector Ion reflector Iondetector Daughter ion mass spectrum The daughter ion spectrum can only be measured in segments which have to be pasted together.10 - 15 segments are necessary. 4 3 21
In proteomics, many proteins have to be separated and analysed fast to avoid degradation • Regarding structure information,MALDI MS/MS appears to be optimal,but PSD is much too slow ! • Consequence: Development of a fast MALDI MS/MS instrument !
MALDI TOF/TOFwith post-acceleration • by potential LIFT
Potential is switched whenions are in LIFT TOF/TOF with LIFT (Scheme) Even low mass ionshave high energy,good for detection All fragment ions can beanalyzed simultaneously,no segmenting necessary Electr. potentialion energy 1. TOF 2. TOF Decaying ions, energy reduced,low speed LIFT Source Reflector
Laser TOF -MS/MS with post-acceleration by LIFT LID PotentialLIFTfor post acceleration Parent ionsupressor MALDI ionsource Parent ionselector Ion reflector Collision Cell (CID) Iondetector MS/MS spectrum of daughter ionsis measured in a single acquisition;no pasting of segments;low sample consumption, high speed, high sensitivity Daughter ion mass spectrum 1 to 200 spectra needed;1 to 10 seconds only with 20 Hertz laser
Data Evaluation Goal : • Identification of Proteins (sequence of amino acids) • and Protein modifications Method : • Fragmentation of proteins / peptides • resulting in PMF / PFF spectra • Detection (annotation) of the masses of the fragments • Identification by databasesearches
Problems to be solved by Bioinformatics • - Detection of peaks with low signal/noise ratio • - Identification (mass, area, intensity) of (overlapping) isotopic patterns • - Score the results • - Detection of multiple charges (TOF spectra z = 1,2) nominal mass Detection of protonated molecular ion [M+H]+ average mass monoisotopic mass Isotopic resolution
Isotopic pattern of peptides • 12C931H14614N2416O2432S+ : monoisotopic 12C931H14614N2315N16O2432S+ : 8.1%, m=2094.0455 12C931H14614N2416O2433S+ : 0.7%, m=2094.0478 12C9213C1H14614N2416O2432S+: 88.9%, m=2094.0517 12C931H14614N2416O23 17O132S+ : 0.9%, m=2094.0526 12C931H1452H14N2416O2432S+ : 1.4%, m=2094.0547
Deisotoping: Assigning monoisotopic masses • SNAP approach: • Peak selection • Damping of chemical noise using FFT filtering • Baseline correction • noise calculation • peak search • Iterative search for isotopic patterns • Analysing the largest peaks first • Alignment of patterns using peak list heuristic and FFT deconvolution • Nonlinear fit using asymmetric line shape • Subtraction of analysed patterns • Reevaluation • Fit of intensities of overlapping patterns, optional addition of ICAT masses • Calculation of Quality Factor
SNAP : Regularized FFT Deconvolution Uncertainty of mean peptide isotopic distribution
SNAP : Nonlinear Fit Local optima for least square fit: - 2 Exponentially modified gaussians for asymmetric line shapes:
SNAP : Quality Factor Idea: Get a value for the quality of a pattern which can be used in favor of S/N or intensity for selecting the “best” peaks 2 Area/Width Mean deviation Basic Scoring , for all patterns Kind of Spectrum/ Instrument Fuzzy Scoring Quality factor
To monoisotopic masses SNAP : Use Case From overlapping peak groups
Inverse Wavelet Transform Wavelet Transform Hard Thresholding Wavelet Methods for Denoising Proteomics Spectra Denoising by Hard Thresholding Scale - adaptive Thresholds Preservation of Position, Shape and Amplitude of major Peaks
Denoising by Hard Thresholding Further Developments • Baseline Correction • Deconvolution of Isotopic Patterns • Scale-Energy Parameters for enhanced Clustering
M16+ 16950.584 2.5 M15+ 1130.7 M17+ 2.0 998.1 1.5 M14+ 1211.5 1.0 M18+ 943.0 16930 16950 16970 M19+ 0.5 1304.7 893.7 M20+ M12+ 849.1 1413.6 800 900 1100 1400 1000 1200 1300 Charge Deconvolution : Without Isotopic Resolution Charge states for ESI Different m/z peaks of Equine ApomyoglobinProtein MW is calculated from m/z differences between adjacant peaks by deconvolution software (result see inlet). Protein Z = 15-70 Peptide Z = 1,2,3,4 Small molecules Z = 1 Related Ion Deconvolution [M+zH]z+/z M Peak Picking m/z ; intensity Deconvolution envelope; distances Result Z + MW m/z
(M+4H)4+ (M+5H)5+ d (m/z) =0.2 u d (m/z) =0.25 u 1148 1434 Charge Deconvolution: Isotopic Resolution For isotopically resolved patterns the charge state and the mass can be determined from a single pattern.
Problems to be solved by Bioinformatics • Calibration Get more accurate data
Automatic „Smart“ Calibration Mass distribution of peptides Contaminants, self digestion External calibration spots Statistical References Internal Calibrants External Calibration • Automatic Control based on external and internal data • Resulting Accuracy <10 ppm • High Precision Correction improves stability & accuracy Automatic “Smart” Calibration Tof(m/z) = c0 +c1 (m/z)1/2 +c2 (m/z) + fixed high precision correction
Statistical Calibration for Proteomics Peaklist Statistical Reference Masses Assign Masses (dM < dErr) • Initial Error dErr<500 ppm • Using modified Mann’s clustering • Resulting Accuracy <20ppm Calibrate dErr := Max(50, 0.5*dErr) Yes No dErr>=50 Stop
1.Calibration round Exclusion limit 150ppm Final calibration 2.Calibration round Exclusion limit 40ppm calibration, reject in- accurate masses calibration, reject in- accurate masses calibration, reject un- matched masses average error: 13.4ppm average error: 16.3ppm average error: 66.7 ppm Details of the Calibration Routine: Internal Multipoint Calibration – an Example Matching with contaminants Exclusion limit 800ppm error [ppm] measured mass [Da]
Iterative Generation of internal calibrant list Start of PMF identification with a default calibrantlist Calibration PMFSearch usually 2 repeats are sufficient Generation of an improved calibrant list The default calibrant list usually consists of three typical trypsin peptides Improved calibrant lists typically contain of 60-100 masses – averagely 10-20 of these can be found in a spectra
Problems to be solved by Bioinformatics • MS based • Identity Search Search Engines
MS Protein Identification is Probability based How closely is a given protein or peptide sequence matching to the measured masses ? There are several strategies for a matching “ score“ : • For example: • Probability based MOWSE score (Mascot) • Bayesian probability (ProFound) • Cross correlation (MS-Fit) Masses determined by MS are not unique Identification is probability based Problem of assigning true probabilities to a given identification
Evaluation of PMF and Search Engines Part 1 Comparison of the performance of the search engines using a typical set of search parameters. Part 2 Successively changing various search parameters to test their influence. Optimisation of search parameters. Dataset: 168 MALDI PMF spectra the data was acquired in the environment of a typical proteome project About 10,000 searches have been performed to establish a statistical basis
Comparision of PMF Search Engines – Score Distribution 20 20 5% significance level 18 18 ProFound 5% significance level 16 16 14 14 12 % of searches 12 % of searches 10 10 Mascot 8 8 6 6 4 4 2 2 0 0 0.0 0.5 1.0 1.5 2.0 2.5 0 50 100 150 200 250 300 Mascot score ProFound Z score 20 18 MS-Fit 16 14 12 % of searches 10 8 6 4 2 0 0 1 2 3 4 5 6 log (MS-Fit MOWSE Score)
Converting the Scoring Distribution to a MetaScore ProFound - scoring distribution 20 5% significance level 18 range of uncertainty 16 correct identifications 14 12 random matches 10 % of searches 8 6 4 2 0 0.0 0.5 1.0 1.5 2.0 2.5 ProFound Z score Idea:Integration of search results from different engines could improve significance and confidence! An effective ranking of results can be assessed by individual search score distributions
Ranking of Search Results of different PMF algorithms by MetaScore • - Effective sorting of reported results of several search engines • More correct Proteins are on rank number one • Elimination of false positives • drawback: MetaScore does not reflect true probabilities
Problems to be solved by Bioinformatics • Automated validation • of Search Results Search Engines
Fuzzy Engine • MetaScoring MTP-Viewer No Yes MS/MS • Auto MS/MS definition • Search result driven • Queries m/z m/z m/z From Automation to High Throughput List of precursor masses Result judgement Result visualization PMF Identified ?
Fuzzy Engine for Protein Identifikation from PMF spectra FL Identified Identified (multiple) Probability Score Undefined Uncertain (unique) Uncertain (multiple) Bad data Probability Score Score Ratio to unrelated Sequence Sequence Coverage Correlation Coefficient Peak Quality Factor
Problems to be solved by Bioinformatics • Automated • MS/MS Precursor Ion Selection Automation & High Throughput
Acknowledgement Bruker Daltonik Jens Decker , Michael Kuhn Martin Blüggel , Daniel Chamrad Peter Maaß Kristian Bredies