Download
1 / 9
90 likes | 177 Views
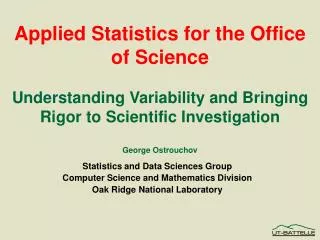
ORNL Statistics and Data Sciences Understanding Variability and Bringing Rigor to Scientific Investigation. George Ostrouchov Statistics and Data Sciences Group Computer Science and Mathematics Division. Common evolutionary steps: Experimental science and computational science.

E N D
ORNL Statistics and Data Sciences Understanding Variability and Bringing Rigor to Scientific Investigation George Ostrouchov Statistics and Data Sciences Group Computer Science and Mathematics Division
Common evolutionary steps:Experimental science and computational science • Early computational science relies largelyon intuitive design and visual validation • Computational experiments are expensive • Petascale data sets are nearly as opaqueas real systems—statistical analysismust select what to visualize • Uncertainty analysis is in its infancy • Statistics is a major partner in bringing computational science to the rigor and efficiency standards of experimental science • Methods to see through, examine, and classify variability • Uncertainty quantification • Statistical design of experiments Beckerman_0611
ORNL statistics and data sciences group: Cutting through the fog of high-dimensional variability • High-dimensional multivariate classification for chem-bio mass spectrometer • Climate: Compact representation and insight in high-dimensional climate simulation space • Network intrusion detectionwithout content analysis • High-dimensional density space classification • Visualization ofhigh-dimensional relationships • Fusion: Mapping clustered heating coefficient space to tokamak cross-section space Beckerman_0611 3 Ostrouchov_SDS_0611
Statistical decomposition of time-varying simulation data 1t • Transform to reducenon-linearity in distribution(often density-based) • PCA computed via SVD(or ICA, FA, etc.) • Constructionof component movies • Interpretation of spatial, time, and movie components • Pairs of equal singular values indicate periodic motion 2t ƒ (Xt) = S0 +1t S1 + … + kt Sk + Et S1 Beckerman_0611 EETG GTC Simulation Data (W. Lee, Z. Lin, and S. Klasky) Decomposition shows transient wave components in time
Statistical decomposition of time-varying simulation data • Time dynamicsof component pairsi j stand outin a smallmultiples plot • Movies of any component combinations or residuals provide further viewsof dynamics ¿ Beckerman_0611 ƒ(Xt) = S0 +1t S1 + … + ktSk + Et
Conditional small multiples provide access to high-dimensional relationships • Five-dimensional climate relationship involving surface heat exchange • Latent heat flux: x • Radiative heat flux: y • Various precipitationregimes: Rows • Time of day: 6 a.m. left columns, 6 p.m. right columns • Across a century of increasing CO2; century divided into three parts: Columns (1,4), (2,5), (3,6) • Hexagonal binning on alog scale controls overplotting Beckerman_0611
C1 b1 c1 C2 b1 c1 bk ck C5 b1 c1 bk ck C3 b1 c1 . . . . . . . . . . . . . . . . . . . . C4 NULL RobustMap multiscale data decomposition Hierarchical data decompositionand dimension reduction with O(np) complexity Axis represents difference between data groups Each set of axes represents a local data group Internal nodes contain axes for data splits Leaf nodes contain axes for local dimension reduction n data points in p dimensions Beckerman_0611
More data Human bandwidth overload? Petabytes Terabytes Gigabytes Megabytes Visualization scalability through guidance by statistical analysis No analysis More statistical analysis From local models to annotated data in global context through clustering in a high-dimensional feature space A statistical framework for guiding visualization of massive data sets Browse a petabyte of data? • To see 1% of a petabyteat 10 MB per second takes35 work days! • Statistical analysis must select views or reduce to quantities of interest in additionto fast rendering of data Beckerman_0611
Contact George Ostrouchov Statistics and Data Sciences Group Computer Science and Mathematics Division (865) 574-3137 ostrouchovg@ornl.gov Beckerman_0611 9 Ostrouchov_SDS_0611