Download
1 / 17
230 likes | 1.13k Views
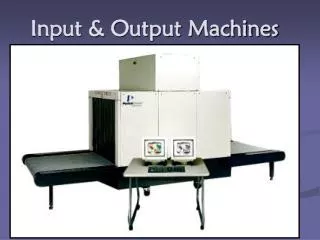
Input – Output Analysis. Widita Kurniasari Universitas Trunojoyo. Input – Output Analysis (Analisis Masukan-Keluaran). Merupakan suatu model matematis untuk menjabarkan struktur perekonomian yang saling berhubungan antar sektor atau kegiatan ekonomi. Pertanian. Industri. Input. Output.

E N D
Input – Output Analysis Widita Kurniasari Universitas Trunojoyo
Input – Output Analysis (Analisis Masukan-Keluaran) • Merupakan suatu model matematis untuk menjabarkan struktur perekonomian yang saling berhubungan antar sektor atau kegiatan ekonomi. Pertanian Industri Input Output Input Output
Matriks Transaksi (Matriks Input – Output) Output input
Keterangan Tabel Input - Output • Pembacaan tabel ke samping dari Total Output pertanian sebesar 100, senilai 20 berupa output yang digunakan oleh sektor itu sendiri, senilai 35 berupa output digunakan oleh sektor industri, senilai 5 berupa output digunakan sebagai masukan(input) sektor jasa dan sisanya senilai 40 dibeli oleh konsumen akhir sebagai barang konsumsi. • Pembacaan tabel ke bawah menjelaskan bahwa dari total output pertanian senilai 100, 20 berupa input dari sektor itu sendiri, 15 berupa input yang berasal dari sektor industri, 10 berupa input dari sektor jasa dan sisanya sebesar 55 merupakan nilai tambah sektor pertanian tsb.
Matriks Transaksi Input Output 20 35 5 15 80 60 10 50 55 T =
Koefisien Input-Output 0,20 0,12 0,02 0,15 0,28 0,26 0,10 0,17 0,23 Matriks T Koef I- O = A = Total Output Value Added Koef VA = V = 0,55 0,43 0,49 Total Output
Matriks Leontief • X = AX + C dimana, X = Matriks Total Output (output matrix) A = Matriks Koefisien (coefficient matrix) C = Matriks Permintaan Akhir (final demand matrix) • X – AX = C (I – A)X = C X = (I – A)-1 C dimana (I – A) = Matriks Leontief
Matriks Leontief X = (I – A)-1 C 50 130 110 0,20 0,12 0,02 0,15 0,28 0,26 0,10 0,17 0,23 A = C = Tentukan Total Output (matriks X)apabila permintaan akhirnya berubah (matriks C) diatas! 0,80 -0,12 -0,02 -0,15 0,72 -0,26 -0,10 -0,17 0,77 (I – A) =
Invers Matriks Leontief (I-A)-1 = 1 . (I-A)kT (I – A)-1 = …??? |I-A| |I – A| = 0,39 0,72 -0,26 -0,17 0,77 -0,15 -0,26 -0,10 0,77 -0,15 0,72 -0,10 -0,17 - (I-A)k = -0,12 -0,02 -0,17 0,77 0,80 -0,02 -0,10 0,77 0,80 -0,12 -0,10 -0,17 - - -0,12 -0,02 0,72 -0,26 0,80 -0,02 -0,15 -0,26 0,80 -0,12 -0,15 0,72 -
Invers Matriks Leontief 0,51 0,15 0,10 0,10 0,62 0,15 0,02 0,21 0,56 0,51 0,10 0,02 0,15 0,62 0,21 0,10 0,15 0,56 (I-A)k = (I-A)kT= (I-A)-1 = 1 . (I-A)kT |I-A| 0,51 0,10 0,02 0,15 0,62 0,21 0,10 0,15 0,56 1,31 0,26 0,05 0,38 1,59 0,54 0,26 0,38 1,44 (I-A)-1 = 1 = 0,39
Output Matrix X = (I – A)-1 C 50 130 110 1,31 0,26 0,05 0,38 1,59 0,54 0,26 0,38 1,44 X = X 104,8 285 220,8 X =
Latihan Soal 1 Hubungan input-output antar sektor dalam perekonomian sebuah negara diketahui seperti ditunjukkan oleh tabel transaksi di bawah ini:
Hitunglah masing-masing koefisien inputnya • Jika permintaan akhir terhadap sektor pertanian, industri, dan jasa diharapkan masing-masing berubah menjadi 25, 201, dan 45 berapa total output yang baru bagi masing-masing sektor tersebut • Hitunglah nilai tambah yang baru bagi masing-masing sektor
Latihan Soal 2 • Untuk data serupa dengan soal diatas, hitunglah total output per sektor bila permintaan akhirnya berubah menjadi 30 untuk sektor pertanian, 150 untuk sektor industri dan 125 untuk sektor jasa
Latihan Soal 3 Hubungan input-output antar sektor dalam suatu perekonomian ditunjukkan oleh tabel berikut: • Hitunglah masing-masing koefisien inputnya • Berapa output total per sektor bila permintaan akhir terhadap setiap sektor yang diharapkan merata menjadi sama-sama 60? • Hitung juga perubahan nilai tambah setiap sektor
Latihan soal 4 Berdasarkan data soal no. 3 bila permintaan akhir berubah menjadi 120 (sektor A) dan 40 (sektor B) serta 10 (sektor C). Berapa kenaikan atau penurunan total output masing-masing sektor?
Terima Kasih & Selamat Belajar