Download
1 / 1

E N D
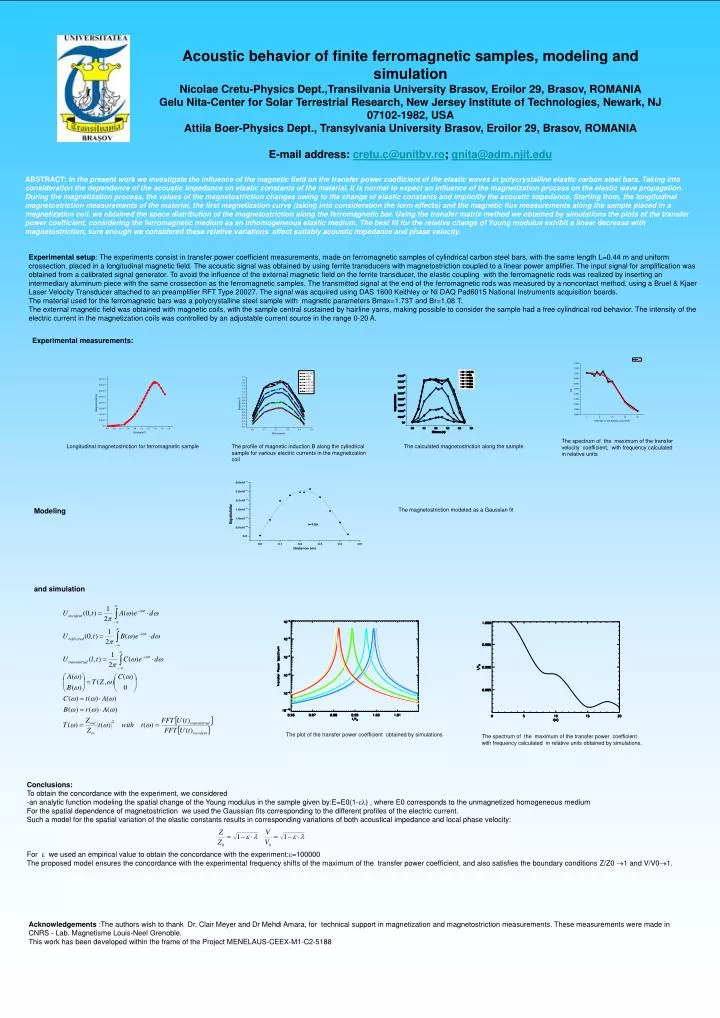
Acoustic behavior of finite ferromagnetic samples, modeling and simulationNicolae Cretu-Physics Dept.,Transilvania University Brasov, Eroilor 29, Brasov, ROMANIAGelu Nita-Center for Solar Terrestrial Research, New Jersey Institute of Technologies, Newark, NJ 07102-1982, USAAttila Boer-Physics Dept., Transylvania University Brasov, Eroilor 29, Brasov, ROMANIAE-mail address: cretu.c@unitbv.ro; gnita@adm.njit.edu ABSTRACT: In the present work we investigate the influence of the magnetic field on the transfer power coefficient of the elastic waves in polycrystalline elastic carbon steel bars. Taking into consideration the dependence of the acoustic impedance on elastic constants of the material, it is normal to expect an influence of the magnetization process on the elastic wave propagation. During the magnetization process, the values of the magnetostriction changes owing to the change of elastic constants and implicitly the acoustic impedance. Starting from, the longitudinal magnetostriction measurements of the material, the first magnetization curve (taking into consideration the form effects) and the magnetic flux measurements along the sample placed in a magnetization coil, we obtained the space distribution of the magnetostriction along the ferromagnetic bar. Using the transfer matrix method we obtained by simulations the plots of the transfer power coefficient, considering the ferromagnetic medium as an inhomogeneous elastic medium. The best fit for the relative change of Young modulus exhibit a linear decrease with magnetostriction, sure enough we considered these relative variations affect suitably acoustic impedance and phase velocity. Experimental setup: The experiments consist in transfer power coefficient measurements, made on ferromagnetic samples of cylindrical carbon steel bars, with the same length L=0.44 m and uniform crossection, placed in a longitudinal magnetic field. The acoustic signal was obtained by using ferrite transducers with magnetostriction coupled to a linear power amplifier. The input signal for amplification was obtained from a calibrated signal generator. To avoid the influence of the external magnetic field on the ferrite transducer, the elastic coupling with the ferromagnetic rods was realized by inserting an intermediary aluminum piece with the same crossection as the ferromagnetic samples. The transmitted signal at the end of the ferromagnetic rods was measured by a noncontact method, using a Bruel & Kjaer Laser Velocity Transducer attached to an preamplifier RFT Type 20027. The signal was acquired using DAS 1600 Keithley or NI DAQ Pad6015 National Instruments acquisition boards. The material used for the ferromagnetic bars was a polycrystalline steel sample with magnetic parameters Bmax=1.73T and Br=1.08 T. The external magnetic field was obtained with magnetic coils, with the sample central sustained by hairline yarns, making possible to consider the sample had a free cylindrical rod behavior. The intensity of the electric current in the magnetization coils was controlled by an adjustable current source in the range 0-20 A. Experimental measurements: The spectrum of the maximum of the transfer velocity coefficient, with frequency calculated in relative units Longitudinal magnetostriction for ferromagnetic sample The profile of magnetic induction B along the cylindrical sample for various electric currents in the magnetization coil The calculated magnetostriction along the sample Modeling The magnetostriction modeled as a Gaussian fit and simulation The plot of the transfer power coefficient obtained by simulations The spectrum of the maximum of the transfer power coefficient with frequency calculated in relative units obtained by simulations. Conclusions: To obtain the concordance with the experiment, we considered -an analytic function modeling the spatial change of the Young modulus in the sample given by:E=E0(1-) , where E0 corresponds to the unmagnetized homogeneous medium For the spatial dependence of magnetostriction we used the Gaussian fits corresponding to the different profiles of the electric current. Such a model for the spatial variation of the elastic constants results in corresponding variations of both acoustical impedance and local phase velocity: For we used an empirical value to obtain the concordance with the experiment:=100000 The proposed model ensures the concordance with the experimental frequency shifts of the maximum of the transfer power coefficient, and also satisfies the boundary conditions Z/Z0 1 and V/V01. Acknowledgements :The authors wish to thank Dr. Clair Meyer and Dr Mehdi Amara, for technical support in magnetization and magnetostriction measurements. These measurements were made in CNRS - Lab. Magnetisme Louis-Neel Grenoble. This work has been developed within the frame of the Project MENELAUS-CEEX-M1-C2-5188