Download
1 / 14
140 likes | 267 Views
Northern Oil and Gas Company (NOG). Brief history of recent US oil boom. US has been aware of massive shale oil deposits since 1960s Didn’t become economically viable to drill them until around 2005 (hydraulic fracturing and horizontal drilling)

E N D
Brief history of recent US oil boom • US has been aware of massive shale oil deposits since 1960s • Didn’t become economically viable to drill them until around 2005 (hydraulic fracturing and horizontal drilling) • US oil production grew on average 45% between 2005 and 2010 • Growth expected to continue, US expected to be a net exporter by 2020 • US passed Russia in November 2012 to become world’s leading natural gas producer
Global view • IMF just upgraded world economic growth to 3.7% for 2014 • BNY Mellon: 3.5-3.75% for 2014 • Vanguard: 3.4% for 2014, first time they’ve seen cyclical growth indicators since the financial crisis • Merrill Lynch projects strongest growth year for US since financial crisis, emphasizes cyclical industries (such as oil) • Citi predicts 3.1% growth for global economy and a doubling in growth of advanced economies
Domestic/Industry view • US expected to be a net exporter of oil by 2020 • Domestic oil production rose 15% in 2013
Domestic/Industry view • US domestic oil industry is highly fractured • Mostly made up of Exploration and Production companies (E&P) who buy land on oil-rich shale formations, assess the land for oil, drill wells, and produce oil from those wells • E&P companies are generally much smaller than traditional multinational oil companies (BP, Exxon) and much more abundant (notable players include NOG, EOG, KOG, OAS, CLR, WLL, etc.)
Domestic/Industry view • Oil prices reached a recent high of $96.73 today, narrowing the WTI/Brent spread to $11, the smallest gap since Dec. 19th • Current prices are expected to continue to rise • Freezing weather in the East (another cold front is expected) • Turmoil in North Africa, the Middle East, and Eastern Europe • Increasing transportation infrastructure and refinery capacity
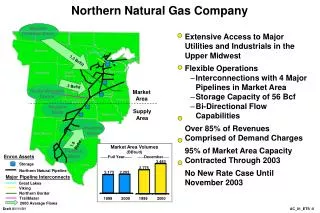
NOG • NOG has a unique business model in the domestic oil landscape • Rather than actually drill wells and produce the oil themselves, NOG specializes in leasing acreage on which other companies drill • Often do this by taking a working interest in the well, taking a direct cut of the revenues it produces • Years of experience make them experts in land assessment • Land acquisition strategy (small leases) has proven effective • By taking a working interest in a diverse range of drilling companies, NOG spreads risk
Selected Financials • Increased total production by 95% in 2012 • Increased proven reserves by 44% in 2012 • Participated in completion of 563 wells in 2012, with 100% success rate • 64% of acreage held in 2012 was either in production, being developed, or permitted for drilling • Total liquidity was $240m
Selected Financials • Current ratio = .64 • Debt ratio = 1.7 • P/E: 17.24 • Peer average: 23.01 • Free cash flows inconsistent, but positive in 2012 and on track to be positive for 2013
Risks • WTI/Brent differential • Decreasing oil prices? • Bakken oil safety regulations