Download
1 / 17
170 likes | 349 Views
Use of Hidden Markov Models and Phenology for Multitemporal Satellite Image Classification . Applications to Mountain Vegetation Classification. MultiTemp 2005. Lars Aurdal, Ragnar Bang Huseby, Dagrun Vikhamar, Line Eikvil, Anne Solberg, Rune Solberg. Aim of project.

E N D
Use of Hidden Markov Models and Phenology for Multitemporal Satellite Image Classification Applications to Mountain Vegetation Classification MultiTemp 2005 Lars Aurdal, Ragnar Bang Huseby, Dagrun Vikhamar, Line Eikvil, Anne Solberg, Rune Solberg
Aim of project • Our aim was to study satellite image classification based on class temporal evolution in multitemporal sequences . • Specifically we considered vegetation ground cover classification based on such sequences. • Classification based on 7 LANDSAT TM and ETM+ images. • Digital vegetation maps of the study area were provided by the Norwegian Institute of Land Inventory (NIJOS).
Previous work • The annual changes in the vegetation ground cover includes the phenological development of the different plant species that make up the ground cover. • Many works on ground cover classification have used the varying phenological cycles observed in the images to distinguish between different ground cover classes. • Few authors actually model the phenological evolution of different plant societies in order to use this in the classification process.
Phenological evolution of different plant species, NDVI Birch Pine
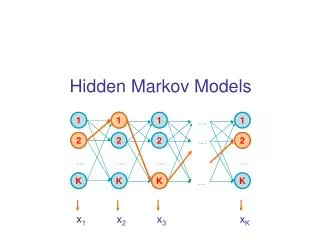
Model • We model the ground cover phenology using a Hidden Markov Model (HMM). • The basic assumption is that the vegetation will be in one of four states, dormancy, greenup, maturity or senescence. • These states are hidden for the observer, all that can be known about these states is the probability of transition between these states as a function of the time of the year and the probability of observables in a given state.
Model • While in one of these states the vegetation ground cover produces observables (satellite images in our case). • Each vegetation ground cover class will produce observables with an estimated mean and variance. • The classification problem becomes the problem of choosing the ground cover class that best explains the given sequence of observables.
Model • To specify the HMM for the phenological evolution of a ground cover vegetation class you need: • The states of the system. We consider 6 states, snowcover, dormancy1, greenup, maturity, senescence and dormancy2. • The state transition matrices, these are time varying, but can be assumed constant within for instance one week intervals. • The probabilities of the observables given a certain state and class.
High mountain vegetation classification Left: Norwegian national borders and a LANDSAT 199-17 scene. Right: Norwegian national borders and vegetation maps (vegetation maps provided by NIJOS) Venabygd Sør-Fron
High mountain vegetation classification Venabygd vegetation map reduced to only 5 plant societies. The color coding is given in the legend. White areas are either outside the Vena region or areas not interesting for classification (water e.g.).
High mountain vegetation classification, results HMM Vegetation map Venabygd test area, all seven LANDSAT images classified using the HMM approach. All 6 bands where used as input to the classifier. The overall classification accuracy was 63.1%.
High mountain vegetation classification, results • For comparison: • A trained maximum likelihood classifier was applied to the Venabygd test area in each of the 7 images separately. The best overall classification accuracy was 58.2%.. • A trained maximum likelihood classifier was applied to the Venabygd test area in a stack of all 7 images. The overall classification accuracy was 63.4%. • Using the same training data both the HMM and the ML approach was applied to the Sør-Fron test area in a stack of all 7 images. The overall classification accuracy was 62.4% (HMM) and 56.3% (ML).
Conclusions • We have developed a HMM based classification algorithm. • Experiments using the HMM approach and the ML approach clearly shows the value of using multitemporal data. • When trained locally the ML approach is superior. • The ML approach generalizes very poorly (overadaptation) • The HMM approach generalizes well.
Conclusions • The HMM based classification algorithm has many desirable features: • The number of images in the multitemporal sequence can change. • Snow and cloud cover can easily be modeled. • More detailed modeling of phenology is possible.