Download
1 / 31
310 likes | 414 Views
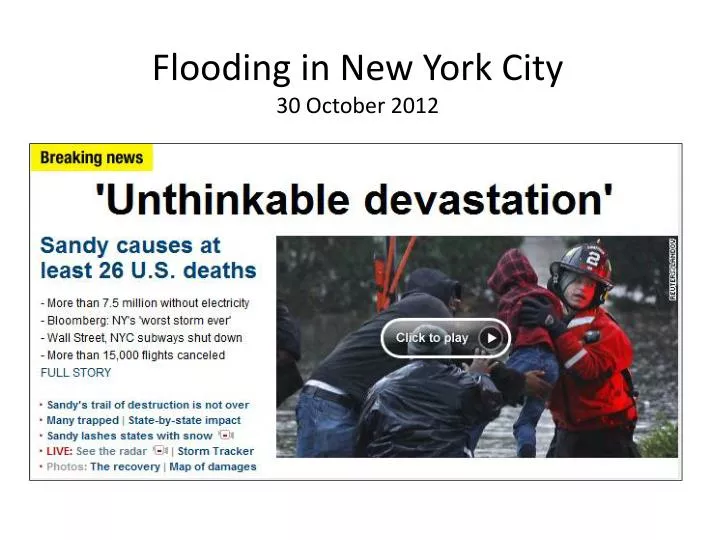
Flooding in New York City 30 October 2012. Current Conditions. Projected 5-day Rainfall from Sandy. Where is Risk the Greatest?. Source: Scott Edelman (Watershed Concepts). Beaufort County, North Carolina. Elevation source for SLR mapping: 30-m DEM.

E N D
Where is Risk the Greatest? Source: Scott Edelman (Watershed Concepts)
Beaufort County, North Carolina Elevation source for SLR mapping: 30-m DEM Elevation source for SLR mapping: 3-m lidar data Darker blue tint: Land ≤ 1 meter in elevation Lighter blue tint: Area of uncertainty associated with 1 meter elevation
WHEN STORM SURGE REACHES THE COAST Spencer Rogers North Carolina Sea Grant UNC-Wilmington Center for Marine Science NCSU Dept. of Civil Engineering
Storm Surge STEEP OFFSHORE SMALL STORM SURGE
Storm Surge FLAT OFFSHORE HIGH STORM SURGE
Storm Surge ISLAND SMALL STORM SURGE
Storm Surge Straight Shoreline MODERATE STORM SURGE
Storm Surge Bay HIGHEST STORM SURGE
TX LA MS AL FL
Dune Myth • MYTH: Dunes provide protection from chronic erosion • FACT: Dunes provide little or no protection from chronic erosion
Base Flood Elevation Figure D-21, p. D-69 of “Guidelines and Specifications For Flood Hazard Mapping Partners, Appendix D, Coastal Flooding Analysis and Mapping, FEMA, April 2003
Typical Transect Figure D-27, p. D-95 of FEMA Appendix D
Comparison of FIA depth-damage functions, V zones and A zones
100% Coastal A Zone A Zone V Zone DESTROYED 50% GULF of Mexico HURRICANE FREDRIC GULF SHORES AL 1979, NO MAINTENANCE 0% 0 1000’ Fig 2. Unmapped Coastal A-zones DISTANCE FROM GULF
Uncertainties in Coastal Flood Mapping-with a focus on the models • Review science and definitions • Review methods for calculating BFE • Identify sources of uncertainty for BFE • Input data, models, zone mapping • Recommend ways to improve uncertainty Peter Sheng
Storm Surge and Coastal Flooding High wind and low pressure create a large bulge of water, which has no place to go over shallow water. It spills onto the coastline and floods the beach and properties, often extending many miles inland. Flood Elevation is: FE = surge + tide + wave setup + precipitation + river flow FEMA Base Flood Elevation: BFE = 100-year SWL* + wave setup + 0.6 * controlling wave height http://www.usatoday.com/graphics/weather/gra/gsurge/flash.htm
Current Hurricane Wind Models • Realtime Models – • High-Resolution WRF/HWRF (NCAR, NCEP) • MM5 (FSU, UM, etc.) • GFDL • PBL, Windgen • Analysis Wind Models – • H* Wind (NOAA/HRD) • Analytical Model (Holland, NHC) H*wind is the best analysis wind, including some land effect
ADCIRC (Advanced CIRCulation) Model Finite element model, used by USACE for the IPET study How much resolution is absolutely necessary???
Wave Setup and Runup • Wave runup (R(t)) is the time-varying fluctuation of water-level elevation at the shoreline due to wave breaking. • Wave setup (η), the time-averaged water level, is the super-elevation of still water at the shoreline, again due to wave breaking. • The magnitude of both runup and setup are related to offshore wave period, wave height (H), and foreshore beach slope (β). The elevation of wave runup and setup are often calculated from modeled offshore wave conditions using field-data-based empirical parameterizations. • During storm conditions, the wave runup and setup can double the elevation of water levels at the coast beyond that due to storm surge alone.
FIRM - UF uses coupled surge model (CH3D) and wave model (SWAN) to produce wave setup and wave crest which are then added to the 100-yr still water level (SWL) to produce flood elevation.