Download
1 / 18
180 likes | 325 Views
Overview of the Climate Impact on Regional Air Quality (CIRAQ) Project. Ellen J. Cooter * , Alice Gilliland * , William Benjey * , Robert Gilliam * and Jenise Swall * U.S. EPA, National Exposure Research Laboratory, Atmospheric Modeling Division, Research Triangle Park, NC

E N D
Overview of the Climate Impact on Regional Air Quality (CIRAQ) Project Ellen J. Cooter*, Alice Gilliland*, William Benjey*, Robert Gilliam* and Jenise Swall* U.S. EPA, National Exposure Research Laboratory, Atmospheric Modeling Division, Research Triangle Park, NC 2004 Models-3 Conference October 18-20, 2004 *On assignment from NOAA Air Resources Laboratory
Climate Impacts on Regional Air Quality (CIRAQ) • Objective: Examine potential climate change impacts on O3 and PM using the regional scale Community Multiscale Air Quality (CMAQ) model linked with global scale climate and chemical transport models • Supports U.S. Climate Change Science Program (CCSP) research goals and synthesis products • AMD PIs include: Ellen Cooter Project management Climate assessment, landscape/vegetation change Alice Gilliland CMAQ modeling and linkages with global CTMs Bill Benjey Air quality emissions, future emission scenarios Robert Gilliam Regional climate model evaluation • Collaborators include: • Ruby Leung Pacific Northwest National Laboratory (MM5 RCM) • Dan Loughlin EPA NRMRL (future emission scenarios) • Daniel Jacob Harvard University (GISS, GEOS-CHEM) Loretta Mickley • Peter Adams Carnegie Mellon University (global CTM) • Ron Neilson USDA-FS, Pacific Northwest Research Station
Vegetation Change Air Quality (Ozone and PM) Biogenic emissions CIRAQ Information Flow and Responsibilities Agency Key EPA / NOAA(ASMD) GCM (Harvard via STAR) EPA /NRMRL EPA / NCEA DOE / PNNL USDA /FS MM5/RCM Meteorology (GCM Downscaling) Anthropogenic Emissions CCSP Synthesis Report 4.5 Air Quality Scenarios CCSP Synthesis Report 4.6 Socioeconomic Impacts of Climate Variability CCSP Base Program 3. Atmospheric Composition
CIRAQ Project Timeline • FY03-05 Understanding the global to regional climate linkage to support regional scale air quality simulations • FY04-07 Understanding the impact of climate change on regional air quality (CIRAQ Phase 1) • Develop 5-yr current and future (fixed technology and landuse) emissions scenarios • Perform 5-yr current and future (2050) CMAQ simulations • FY06-09 Understanding the impact of climate and emissions changes on regional air quality (CIRAQ Phase 2)
Downscaled Meteorology(linking global and regional scale climate) • GCM (Harvard University) • GISS version II’ • 6hrly output saved for 10 present-day and 10 future years. • Used as boundary and initial conditions to MM5 • Downscaling with MM5 (DOE/PNNL) • MM5 run in regional climate mode • 23 layers, MRF planetary boundary layer parameterization, Grell cumulus cloud parameterization, RRTM radiation scheme and mixed phase microphysics • 36km x36km horizontal resolution spanning continental US, northern Mexico and southern Canada
The Regional Climate Model Data Management and Quality Control Tool (Lead, Gilliam) Smoke Emissions
RCM Evaluation/Analysis The Goal: To understand climatological biases that could impact CMAQ model performance The Challenge: RCM scenarios characterize time periods under representative climatological conditions and will not necessarily reproduce day-to-day and exact year-to-year observations. The Solution: Base evaluation on temporal and spatial characteristics of model output means, extremes and variability.
MM5/RCM Obs
MM5/RCM/MCIP EvaluationTime Series Analysis (Leads, Gilliland and Swall) • Meteorological conditions include annual, diurnal, and interannual cycles, in addition to stochastic variability • These cyclical components can be isolated using time series analysis techniques (e.g., filtering techniques, Fourier analysis, etc.) • Amplitude of these cycles and the extent of variability can be compared for observational data and model output • Understanding these cyclical patterns allows for better detection of climate change signals and investigation of these changes
MM5/RCM/MCIP EvaluationSpatial Analysis(Lead, Cooter) Goal:Develop methods to compare spatial patterns of gridded meteorological (or other) means and extremes across datasets. Method: • Cluster analysis • Wards (means) • Average linkage and k-means (extremes) Analysis: • Visual – difference mappings • Quantitative – frequency analysis Developed and tested using 10 years of NCEP and NCEP/AMIP reanalysis data
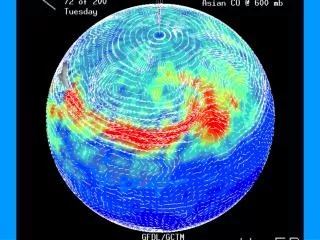
Question: Do average summer season 700mb transport patterns look similar? NCEP Reanalysis R-1 (black arrows) NCEP/AMIP Reanalysis R-2 (red arrows) (R2 – R1)
Question: Are the relative frequencies of average summer season 700mb transport patterns similar? NCEP Reanalysis R-1 NCEP/AMIP Reanalysis R-2 Relative Pattern Frequency Relative Pattern Frequency Pattern Number Pattern Number Location and distribution of patterns 1 and 4 are similar. Location and distribution of patterns 2, 3 and 5 are different
Question: • How many unique (extreme) patterns can be identified? • Ex, NCEP R-1 has 7 patterns; NCEP/AMIP R-2 has 7 patterns • Are the patterns similar across datasets? • Ex. Early summer drought pattern NCEP/AMIP R2 R2-R1 NCEP R1 • Do the patterns occur in a similar fashion across datasets? • Ex., R-1 pattern found 112 times in R-1, R-1 pattern found 99 times in R-2 • Ex, R-2 pattern found 272 times in R-2, R-2 pattern found 198 times in R-1
SMOKE Emission Modeling(Lead, Benjey) Land Cover and Land Use Data BiogenicModel HourlyEmissions MobileModel RCM/MCIP Scenarios Factor Computation MergeProcessing CMAQ AreaModel Emissions Inventories PointModel Hourly LayerFractions
CMAQ Air Quality Simulations(Lead, Gilliland) Plan • O3, PM2.5, PM10, sulfate and nitrate deposition, … • U.S. continental domain, 36 km horizontal resolution • Linkages to global scale chemical transport simulations through boundary conditions • Two global CTMs (Harvard and Carnegie-Mellon) • Both driven by GISS II’ GCM Challenge • Global CTM chemical mechanism matched to SAPRC (AMD) • Temporal and spatial scale issues (Univ. of Houston) CMAQ simulations are expected to begin during FY05
Disclaimer Portions of the research presented here were performed under the Memorandum of Understanding between the U.S. Environmental Protection Agency (EPA) and the U.S. Department of Commerce’s National Oceanic and Atmospheric Administration (NOAA) and under agreement number DW13921548. Although this work was reviewed by EPA and NOAA and approved for publication, it may not necessarily reflect official Agency policy.