Download
1 / 17
180 likes | 431 Views
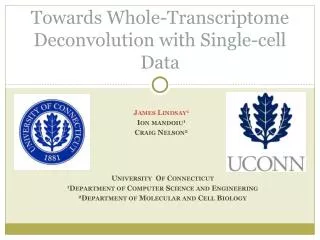
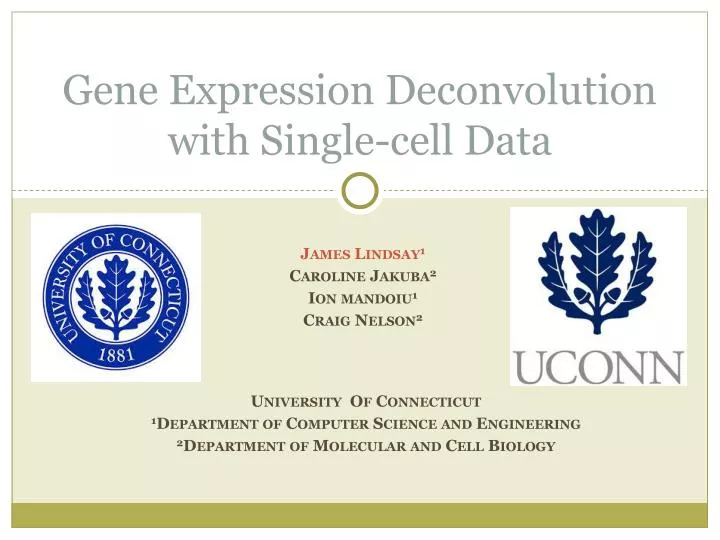
Gene Expression Deconvolution with Single-cell Data. James Lindsay 1 Caroline Jakuba 2 Ion mandoiu 1 Craig Nelson 2. University Of Connecticut 1 Department of Computer Science and Engineering 2 Department of Molecular and Cell Biology. Mouse Embryo. ANTERIOR / HEAD. Neural tube.

E N D
Gene Expression Deconvolution with Single-cell Data James Lindsay1 Caroline Jakuba2 Ion mandoiu1 Craig Nelson2 University Of Connecticut 1Department of Computer Science and Engineering 2Department of Molecular and Cell Biology
Mouse Embryo ANTERIOR / HEAD Neural tube Somites Node Primitive streak POSTERIOR / TAIL
Unknown Mesoderm Progenitor What is the expression profile of the progenitor cell type? NSB=node-streak border; PSM=presomitic mesoderm; S=somite; NT=neural tube/neurectoderm; EN=endoderm
Characterizing Cell-types • Goal: Whole transcriptome expression profiles of individual cell-types • Technically challenging to measure whole transcriptome expression from single-cells • Approach: Computational Deconvolution of cell mixtures • Assisted by single-cell qPCR expression data for a small number of genes
Modeling Cell Mixtures Mixtures (X) are a linear combination of signature matrix (S) and concentration matrix (C) cell types mixtures mixtures cell types genes genes
Previous Work • Coupled Deconvolution • Given: X, Infer: S, C • NMF Repsilber, BMC Bioinformatics, 2010 • Minimum polytope Schwartz, BMC Bioinformatics, 2010 • Estimation of Mixing Proportions • Given: X, S Infer: C • Quadratic Prog Gong, PLoS One, 2012 • LDA Qiao, PLoS Comp Bio, 2o12 • Estimation of Expression Signatures • Given: X, C Infer: S • csSAMShen-Orr, Nature Brief Com, 2010
Single-cell Assisted Deconvolution Given: X and single-cells qPCR data Infer: S, C Approach: • Identify cell-types and estimate reduced signature matrix using single-cells qPCR data • Outlier removal • K-means clustering followed by averaging • Estimate mixing proportions C using • Quadratic programming, 1 mixture at a time • Estimate full expression signature matrix S using C • Quadratic programming , 1 gene at a time
Step 1: Outlier Removal + Clustering Remove cells that have maximum Pearson correlation to other cells below .95 unfiltered filtered
Step 2: Estimate Mixture Proportions For a given mixture i:
Step 3: Estimating Full Expression Signatures cell types mixtures mixtures cell types genes genes C: known from step 2 x: observed signals from new gene s: new gene to estimate signatures Now solve:
Experimental Design • Simulated Concentrations • Sample uniformly at random [0,1] • Scale column sum to 1. • Single Cell Profiles • 92 profiles • 31 genes • Actual Mixtures • 12 mixtures • 31 genes • Dimensions • k = 3 • m = 31 • n = 92, 12 • # mixtures = {10…300} • Simulated Mixtures • Choose single-cells randomly with replacement from each cluster • Sum to generate mixture
Data Processing RT-qPCR • CT values are the cycle in which gene was detected • Relative Normalization to house-keeping genes • HouseKeeping genes • gapdh, bactin1 • geometric mean • Vandesompele, 2002 • dCT(x) = geometric mean – CT(x) • expression(x) = 2^dCT(x)
Concentration Matrix: Concordance predicted
Leave-one-out Accuracy of Inferred Gene Expression Signatures
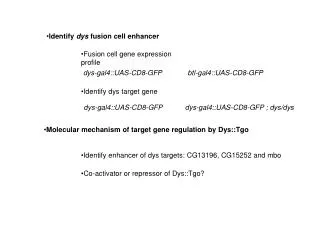
Future Work • Apply gene signature estimation technique using more genes in mixed samples • Identify PSM-Pr Signature • Confirm the anatomical location of the putative PSM-Prcell population through exhaustive ISH
Conclusion Special Thanks to: • Ion Mandoiu • Craig Nelson • Caroline Jakuba • Mathew Gajdosik James.Lindsay@engr.uconn.edu