Download
1 / 28
290 likes | 469 Views
“ 2nd International Conference on Oceanography” July 21-23, Las Vegas, Nevada, USA. Single-cell gene expression analysis – technologies and application Weiwen Zhang Laboratory of Synthetic Microbiology School of Chemical Engineering & Technology Tianjin University, Tianjin , P.R. China

E N D
“2nd International Conference on Oceanography” July 21-23, Las Vegas, Nevada, USA Single-cell gene expression analysis – technologies and application WeiwenZhang Laboratory of Synthetic Microbiology SchoolofChemicalEngineering&Technology TianjinUniversity,Tianjin, P.R.China July22,2014
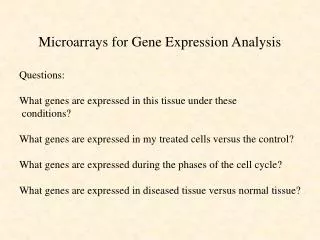
Why analyze gene expression in a single cell? Cancer Stem Cells Analysisfromthepopulationcouldbemisleading!
Why analyze gene expression in a single microbial cell? heterogeneity cell-to-cell variability Lidstrom, M.E., Meldrum, D.R., 2003. Nat Rev. Microbiol, 1:158-164 • Substantial cell-to-cell heterogeneity even in isogenic populations grown under identical conditions. • Gene expression heterogeneity could cause long-term heterogeneity at the cellular level. • In natural ecosystems, microbial cells with diverse genotypes and phenotypes co-existed. • Only less than 1% of microbial species in natural environments can be cultured and accessed by traditional gene expression analysis methods that typically requires a large number of cells.
Synthetic ecology, new frontier in synthetic biology! Building more “robust and controllable” eco-systems for biotechnological application
Single-cell Alternatives to Meta-approaches in Environmental Microbiology • Meta-approaches average cell-cell difference • Cells with diverse genotypes and phenotypes were found within any community • Sub-species (strain) level resolution not available • Single-cell genomics; Single-cell transcriptomics; Single-cell proteomics (?) Single-cell genomics A bacterial chromosome = a few femtograms (10-15 g) of DNA The cellular DNA is amplified >109-fold by multiple displacement amplification (MDA) using random primers Zhang, et al. Nat. Biotechnol. 24, 681–687 (2006).
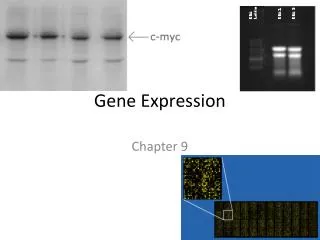
Single bacterial-cell geneexpression Gene expression analysis at single bacterial cell level, is that possible?? Cell No. in each reaction (When E. coli OD600 = 1.0, Cell density = 1X10⁹/mL) M 1 2 3 4 5 6 7 1: groEL2 2-3: rbcL ~ 22 cells 4-5: 16S rRNA 6-7: dnaK E. coli
Two-step RT-qPCR to measuring gene expression in single cell • Brief protocol: • RNA extraction: Carried out using ZR RNA MicroPrep Kit (Zymo Research, Orange, CA) with minor modification. • cDNA synthesis: SuperScript VILO cDNA Synthesis Kit (Invitrogen) • qPCR analysis: EXPRESS SYBR GreenER qPCR SuperMixs Kit (Invitrogen, San Diego, CA) • Multiple genes each cell • Able to separate technical and biological variation Amplification of three individual E. coli cells from the exponential growing population 16S rRNA gene is the amplification target Each reaction used 1/20th of the cDNA Three technical replicates for each cell
Single-cell gene expression analysis of the response to heat shock dnaK 16S rRNA groES ∆Rn 0.1 1.0 10.0 100.0 Negative control Negative controls ∆Rn 0.1 1.0 10.0 100.0 ∆Rn 0.1 1.0 10.0 100.0 Average qPCR CT values and standard deviation among all technical and biological replicates • Three cells (biological replicates) for each condition (controls vs. heat-shock) were individually isolated • Three genes were analyzed in each cell: 16S rRNA, dnaK and groES • Each reaction used 1/20th of the cDNA • Three technical replicates for each gene HS1, HS2, HS3 CC1, CC2, CC3 HS1, HS2, HS3 HS1, HS2, HS3 0 10 20 30 40 Cycle Negative control 0 10 20 30 40 Cycle 0 10 20 30 40 Cycle CC1, CC2, CC3 CC1, CC2, CC3
Gene expression analysis using diluted cDNA from a single bacterial cell E. coli contains 105-106 copies of rRNA molecules! Average qPCR CT values and standard deviation among all technical replicates Gaoetal.,2011,J.Microbiol.Method.85:221-7.
Scheme of analytical procedure Very tiny amount of total RNA: 1-10 femtogram per E. coli cell (1 femtogram = 1e-15 gram)!
Response heterogeneity of Thalassiosira pseudonana to stress Selection of internal control Growth
Response heterogeneity of Thalassiosira pseudonana to stress Analysis of multiple genes in 30 individual cells Shietal.,2013,Appl.Environ.Microbiol. 79:1850-8
Measure mitochondrial geneexpression levels in single cells • Cancerprogressionisaprocessassociatedwitha series of complex, step-wise changesat thebiomolecular level. • Esophageal adenocarcinoma (EAC) is a highly lethal cancertype and is believed to develop from esophageal epithelial cells. • Mitochondria found toplay a major role in thetransformation. • Single-cell analysis ofthe differential hypoxia response in two human Barrett’s esophageal cell lines,CPAandCPC.
Mt copy number difference Bulk cells based Single-cell based
Simultaneous measurement of multiple genes encoded by chr and mt DNA in single cells
We proposed that mitochondria may be one of the key factors in the early cancer progression Wangetal.,2013,PloSOne.8:e75365
Why transcriptomics for single bacterial cell? • qRT-PCR: 5~20 genes/cell • Fluidigm: 96 or more genes/cell • 1,000~10,000 (and more) genes per microorganism
BaSiC-RNAseq: Bacterial Single Cell-RNAseq Singlebacterialcells RNA isolation RNA amplification QC: verification cDNA labeling Illumina Hi-Seq
BaSiC-RNAseq RNA Amplification • NuGen RNA Amplification Kit • Unique at: • primers: random/polyT • Poly DNA polymerase • RNase H • SPIA DNA/RNA primer 1 bacterial cell generated 7~19 μg cDNA
BaSiC-RNAseq: Quality Control Clonal sequencing CyanobacterialSynechocystis sp.PCC 6803 1, 100 bp ladder 2, NTC (H2O as input) 3, single bacterial cell Transformation vector ligation 1 2 3 Blunt-end 3 cell cDNA Sequencing of clone library: All 30 clones are from cyanobacteria NTC 1 cell BlastN against GenBank All Synechocystis sp.PCC 6803 genes! Agarose gel 1%
Synechocystis sp.PCC 6803 Researchhypotheses? 1)Heterogeneity couldvaryupon stress in isogenic bacterial population? 2)Thechangeasadriverforadaptionandevolutionofthepopulation? 24 h Nitrogen starvation 72 h Single cell RNA isolation RNA amplification First strand cDNA Double-stranded cDNA SPIA amplification Post-SPIA modification and purification Bioanalyzer analysis End repair, blunt end cloning transformation Clonelibrary Sequencing of random clones RNA-seq library construction and quantification Single cell RNA-seq analysis
Clusteringanalysis PCAanalysis A) B) Cell-1 Cell-2 Bulk-0h Cell-6 Cell-5 Cell-4 Cell-3 Bulk-72h Bulk-24h C) D) Cell-1 Cell-2 Bulk-0h Cell-3 Cell-6 Cell-5 Cell-4 Bulk-72h Bulk-24h
Heterogeneityincreaseaspart ofstressresponse! A) B) C) Expression in single cell Expression in single cell Expression in single cell R2=0.85 R2=0.77 R2=0.87 Expression in 24-h bulk cells Expression in 24-h bulk cells Expression in 24-h bulk cells D) E) F) Expression in single cell Expression in single cell Expression in single cell R2=0.014 R2=0.028 R2=0.088 Expression in 72-h bulk cells Expression in 72-h bulk cells Expression in 72-h bulk cells
Heterogeneityvariationamong functionalcategories
qRT-PCRverification slr1684 16S sll0945 Adj. R-Square sigma 24h 0.95977 1.17723 72 h 0.95493 1.02529 Adj. R-Square sigma 24h 0.98108 1.15355 72 h 0.92073 1.48065 Adj. R-Square sigma 24h 0.92063 0.76276 72 h 0.97386 1.45617 Heterogeneityincreasein“Mobileelements”couldbeaimportantdriverforcelladaptionandevolution! Wangetal.,2014,Genome Research.,underreview
Summary • Microbialcell-cellheterogeneityincreasinglyrecognized. • Two-stepqRT-PCRprotocolestablishedforanalyzinggeneexpressioninsinglebacterialcells. • Transcriptomicsprotocolestablishedforsinglebacterialcells • Single-cell transcriptomics reveals increasing heterogeneity upon stress in isogenic cyanobacterial population.
Acknowledgments Laboratory of Synthetic Microbiology TianjinUniversity Tianjin University “985” Program” National “973 Program” and “863 program” National Science Foundation of China