Download
1 / 43
440 likes | 560 Views
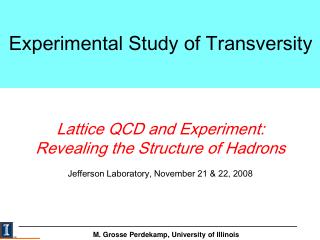
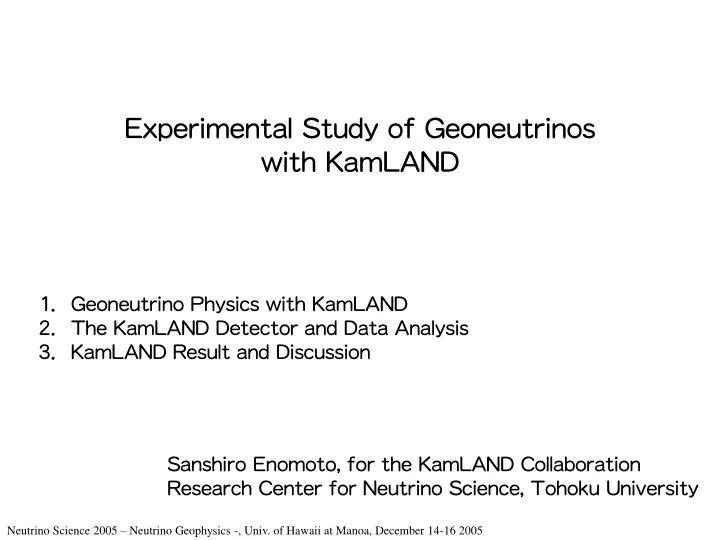
Experimental Study of Geoneutrinos with KamLAND. 1 . Geoneutrino Physics with KamLAND 2 . The KamLAND Detector and Data Analysis 3 . KamLAND Result and Discussion. Sanshiro Enomoto, for the KamLAND Collaboration Research Center for Neutrino Science, Tohoku University.

E N D
Experimental Study of Geoneutrinoswith KamLAND 1.Geoneutrino Physics with KamLAND 2.The KamLAND Detector and Data Analysis 3.KamLAND Result and Discussion Sanshiro Enomoto, for the KamLAND Collaboration Research Center for Neutrino Science, Tohoku University Neutrino Science 2005 – Neutrino Geophysics -, Univ. of Hawaii at Manoa, December 14-16 2005
KamLAND Experiment • observeslow energy anti-neutrinos at the Kamioka Mine, Hida, Japan • consists of 1000ton Liquid Scintillator, surrounded by 1845 PMT’s Reaction: Threshold: 1.8 MeV discriminative sensitivity to antineutrinos →avoids overwhelming solar neutrino background
KamLAND Location KamLAND You are here Sea of Japan Geological Setting KamLAND • Boundary of Continent and Ocean • Island Arc (Orogenic) • ‘Hida’ Metamorphic Zone • Zn, Pb, limestone mine (skarn) • Surrounded by Gneiss Rocks JapanTrench
Geoneutrino Flux Integration Geoneutrino Generation Points (MC) • Geoneutrino Flux at KamLAND • U-series • 2.3x10⁶ [1/cm2/sec] • 30.5 [events/1032protons/year] • Th-series • 2.0x10⁶ [1/cm2/sec] • 8.0 [events/1032protons/year] 1032protons ~1.2kton CH2
Expected Neutrino Spectrum at KamLAND • 408ton CH2 (5m radius volume), 714 days, 69% efficiency • Oscillation parameters from KamLAND 2nd Result expected event rate: U series: 14.9 Th series: 4.0 Reactor (E<3.4MeV): 80.4 geoneutrino analysis window reactor neutrino analysis window
Where Neutrinos Come From? Assuming uniform crustal composition(no local variation), KamLAND Australia Greenland Antarctica South America ‘Earth around Japan’ Japan Island Arc Hida Metamorphic Zone KamLAND is looking at‘Earth around Japan’,if local variation is averaged enough Kamioka Mine
Local Geology Study 1 - Geological Map sedimentary accretionary volcanic plutonic metamorphic ~500km • Japan Geological Map, published from Geological Survey of Japan (1995) • classifies the surface geology into 165 geologic groups.
Local Geology Study 2 -Geochemical Analysis Togashi et.al. (2000)(Geochemistry Geophysics Geosystems, volume 1 number 27) • classifies surface geology into37 groups • collects 166 rock samples to cover rock varieties and abundances
Surface U/Th Distribution Models • This is just a model • This is just for surface • This is everything we have
Effect of Local Geology • Assuming surface exposed geology extends to 5km depth, • Calculates possible variation in geoneutrino flux • Range of variation is about4% • If ‘surface’ is simply extended to whole upper crust, we get ~12% • vertical information is crucial
Comparison with Other Sites Kamioka / Island Arc Gran Sasso / Mesozoic Crust Hawaii / Oceanic Island Sudbury / Archean Crust
Neutrino Detection Method τ~210 μsec time τ~210 μsec
KamLAND Detector Design 1000m 1000ton 225 20-inch 13m diameter LS: 13m 80%: dodecane20%: pseudocumene1.5g/l: PPO 1.75m thickness 1325 17-inch 554 20-inch ~ 8000 photons/MeV λ~ 10m MO: 20m 50%: dodecane50%: isoparafin photo-coverage: 34% ~ 500 p.e. / MeV ρLS/ρMO = 1.0004
LS Purification and Radioactive Impurity before U: ~10-10 g/g, Th: <10-12 g/g, K: 7×10-11g/g after U: 3.5×10⁻¹⁸g/g, Th: 5.2×10⁻¹⁷g/g, K: 2.7×10⁻¹⁶g/g measurable only by KamLAND itself !
Vertex Reconstruction Determined from PMT hit timing Z 650 0 -650 < 5 cm vertex biasin -550cm < Z < 550cm
Visible Energy (light yield) Estimation Determined from total PMT hit charge, with corrections of • light attenuation, balloon / rope shadowing • PMT angle, quantum efficiency, discriminator threshold Visible Energy (photon yield) < 0.8% position dependence in -550cm < Z < 550cm
Energy Scale Study Quenching Cherenkov Light Geoneutrino Window Energy reconstructed within 2% error
Detector Activity (Singles Spectrum) Normal Trigger Range Event Vertices Low Energy Region Major Background Sources: LS impurity (210Pb, 85Kr, 39Ar) extrinsic gamma (40K, 208Tl) muon spallation (10C, 11C, 12B, ...) Measured LS impurity: U: 3.5×10⁻¹⁸ g/g Th: 5.2×10⁻¹⁷ g/g
Event Selection accidentalcoincidencevertices • Fiducial Volume • Muon Spallation Cut (9Li etc) • Coincidence Event Selection • selects500 cm radius from center • removes 120 cm radius from vertical axis • 2sec full volume veto following showering muons • 2sec 3m-cylindrical veto following non-showering muons • Distance: 0 < ΔR < 100cm • Interval: 0.5 μsec < ΔT < 1000 μsec • Delayed Signal Energy: 1.8 MeV < Edelayed < 2.6 MeV ΔR (MC) ΔT (MC) Edelayed (MC) 77% 90% 99.7%
Selected Candidates Summary • Livetime: 749.14 days • # of protons: 3.459x1031 Prompt Signal (Eν-0.8MeV) Delayed Signal(2.2MeV) 152 events Vertex Correlation (~60cm) Time Correlation (τ=210μs)
Backgrounds Overview • Neutrinos • Reactor: 80.4±7.2 • Spent Fuel (Ru, Ce, St) : 1.9±0.2 • Accidental Coincidence : 2.4±0.0077 • Correlated Signals • Muon spallation products (9Li, …): 0.30±0.047 • Fast neutron (from outside): < 0.1 • Cascade decay (Bi-Po, …) • Spontaneous Fission (238U, …) • Neutron Emitter (210Tl, …) • (α,n) Reaction,(γ,n) Reaction • Deuteron disintegration by solar neutrinos • Atmospheric neutrino interaction with 12C
(α,n) Reaction Background Overview 1- 7.117 2+ 6.917 210Po α α-decays of LS impurity 6.130 3- 0+ 6.049 4.1MeV 210Pb 210Bi 210Po 206Pb e+e- γ 22.3 y 5.013 d 138.4 d stable 13C + α-n 2.2MeV 0+ α 16O 13C (α,n) 16O 16O*(6.13) → 16O + γ 16O*(6.05) → 16O + e+ + e- 13C (α,n) 16O* 14N (α,n) 17F promptsignals 15N (α,n) 18F n + p → n + p 17O (α,n) 20Ne n n + 12C → n + 12C* 12C + γ(4.4MeV) 18O (α,n) 21Ne
(α,n) Reaction Backgrounds:210Po Decay Rate 210Po decay rate: 21.1 Bq 1.50×10⁹decays/livetime Uncertainties: Energy scale uncertainty Vertex bias at low-energy region 210Po decay rate non-equibrilum ⇒ 14% systematic error assigned (280keVγ)
(α,n) Reaction Background:Neutron Generation 13C(α,n) angular distribution(Legendre Coefficients) α Spectrum in LS 13C(α,n) Cross Section JENDL 2003 Calculated Neutron Spectrum Uncertainties: (α,n) cross section, branching ratios, angular distribution⇒ 20% error
(α,n) Reaction: Proton Scattering and Visible Energy Neutron Visible Energy Calculation(MC) • n-p scattering(MC) • proton energy loss (numerical) • scintillation light production • no direct measurement available for proton quenching factor • Birks constant uncertainty (calculation requires lots of details) Calculated (α,n) Reaction Spectrum Uncertainties: proton quenching factor (α,n) angular distribution ⇒ 10% horizontal error
Summary of Backgrounds • Neutrinos • Reactor: 80.4±7.2 • Spent Fuel : 1.9±0.2 • Cosmic Muon Induced • Fast neutron(from outside): < 0.1 • Spallation products (9Li): 0.30±0.047 • Radioactive Impurity • Accidental coincidence 2.38±0.0077 • Cascade decay negligible • Spontaneous fission < 0.1 • (α,n) reaction 42.4±11.1 • (γ,n) reactionnegligible 152 eventsobserved total: 127.4 ± 13.3 (syst.)
Expected Spectrum BG + Geoneutrinos Predicted numberby our Earth model BG Total Reactor (α,n) Th-series geoneutrino (4.0 events) U-series geoneutrino (14.9 events) Accidental
KamLAND Observation BG Total Reactor (α,n) Th-series geoneutrino U-series geoneutrino Accidental
Event Rate Analysis • observed: 152 • backgrounds: 127.4 ±13.3 (syst.) • excess: 24.6±17.9 • systematic error: 5.0% (mainly FV; large correlation with backgrounds) Probability of observingN-events under givenneutrino flux Fgeo • significance: 91.4% • geoneutrino events: 25 (19 predicted by Earth models) • 99% C.L. upper limit:72 events +19 -18
Unbinned Spectrum Shape Analysis Incorporates Th/U = 3.9constraint • 90% confidence interval: 4.5 to 54.2 • 99% C.L. upper limit:70.7 • Ngeo=0 excluded at 95.3%(1.99σ)
Comparison with Earth Model Prediction • KamLAND result is consistent with Earth model predictions • 99%C.L. limit is outside of Earth model constraints
KamLAND Future Prospects • (α, n) background study improvements • Better cross section data now available • Proton quenching will be measured • Alpha-source calibration being considered • Further LS purification • Removes radioactive impurities at 104~106 • Reduces backgrounds, increases efficiency
New (α,n) Cross Section Data New measurement by Harissopuloset al. (2005) 22 μg/cm2 Carbon target with 99±2%13C enrichment • Reduces systematic error from 20% to4% • Lowers neutron yield (5%) ? • Some data still missing: • branching to excitation • angular distribution
Proton Quenching Factor Measurement Mono-energetic neutron beam from OKTAVIAN at Osaka University
LS distillation for the KamLAND solar phase Removes radioactive impurities at 104~106
Current Achievement (4.5±0.5)×10-4 Reduction of Pb
KamLAND Prospect After Purification Assuming - 10-5 background reduction - 749 days exposure - Increased Fiducial Volume (5.5m) - Improved Efficiency (90%) • Error is reduced from 54% to 28% • Significance: 99.96% • Error is dominated by reactor neutrino statistics
Summary • KamLAND achieved the first experimental study of neutrinos • 749 days exposure of KamLAND results • 90% Confidence Interval: 4.5 to 54.2 • 99% C.L. upper limit: 70.7 • Consistent with predictions by Earth models • A number of improvements are in progress