Download
1 / 20
200 likes | 299 Views
EXPERIMENTAL DESIGN WITH CASE STUDY 9. By Dr. M.M. Sithole Department of Agric. Econ. and Mangt. Faculty of Agriculture University of Swaziland. 27 th June, 2006 University of Cape Town. Introduction.

E N D
EXPERIMENTAL DESIGN WITH CASE STUDY 9 By Dr. M.M. Sithole Department of Agric. Econ. and Mangt. Faculty of Agriculture University of Swaziland 27th June, 2006 • University of Cape Town
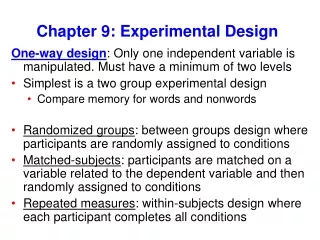
Introduction • Look at Case study 9 after teaching split-plot design to illustrate other problems with layers (sampling is nested). • In my notes, I have the example: • “Effect of Nitrogen on Yield of Two Cultivars of groundnuts (1,2). • Nitrogen is the whole plot factor with 3 levels (0,50 and 100 kg/ha) in 4 blocks. • Thus, Cultivar is the sub-plot factor.
Introduction (Cont.) • Case Study 9 investigates optimum conditions for pollen grain germination of the leguminous tree species Sesbania Seban (L.) Merr tree. • An example of a controlled experiment conducted in a lab.
Introduction (Cont.) • Objectives: • To determine the concentration of sucrose medium that yields optimal pollen grain germination from flower buds of S. sesban. • To determine whether pollen grain viability and germination are highly correlated at this optimal sucrose concentration.
Introduction (Cont.) • Experimental approach – first determine an optimal sucrose concentration that yields a high germination rate, and then to compare viability and germination rates at this sucrose concentration. • Viability determined in flourescein diacetate (FDA) solution in which viable grains flouresce and non-viable ones do not.
Experimental Design • Two experiments: • Using flower buds from a tree at ILRI, Addis Ababa; • Viability in the second experiment determined from mature flower buds, 20, 21, and 22 mm. • Experiment 1: • Exper. 1 attempts to address the first objective. • Six flower buds – two of each of the above three lengths randomly selected from three different directions of the tree.
Experimental Design (Cont.) • Concentration: 0, 5, 10, 15, 20, 25, 30 and 35% • 3x2x8 = 16x3 = 48 glass slides
Experimental Design (Cont.) • Factor: • Conc. (0,5,10,15,20,25,30,35%). • Blocks: • Length (20, 21, 22mm). • Dependent variable = Number of germinating pollen grains. • 15 fields of view.
Experimental Design (Cont.) • “Randomized Block” with Length as “Block” and two buds per block, and with Conc. As “Treat.”
Experimental Design (Cont.) • Quadratic trend signif. • Regression Analysis to determine the equation of the trend. – Conc. and Conc.2 as indep. and germination rate as the dependent var. • Diff. to determine the Conc. that gives max. germination.
Experimental Design (Cont.) • Experiment 2: • Exper. 1 provides optimal sucrose Conc. To compare levels of viability and germination • 6 flower buds as in Exper. 1
Experimental Design (Cont.) • Experiment 2 (Cont): • Viability – in Fluorescein diacetate (FDA) • Germination – Same six flower buds also tested for germination as in Exper. 1 in the optimal sucrose Conc. determined in Exper. 1. • Correlation between Viability and Germination – No signif. Correlation was found.
Concluding Remarks (Cont.) • The Case Study can be used to show other design with sampling in layers, but not necessarily the split-plot design. • The other advantage with the Case Study is that it demonstrates the entire research process, from Research Strategy, to Study Design, to Data Management, to Statistical Modelling and Reporting.
Concluding Remarks (Cont.) • As opposed to teaching the Experimental Design as an isolated entity from the rest of the research process. • This way, it teaches good statistical practice. • It also provides an interesting environment for students to learn. There are pictures, etc.