Download
1 / 25
250 likes | 367 Views
Assignments: Wind Assignment Due Thurs. Nov 5 Study Quizzes for Chap 15 and Chap 19 “Due” Tues. Nov. 10. Technology Review, Oct 2009. Chapter 19: Air Pollution and Noise. Living and Working in a Healthy Environment.

E N D
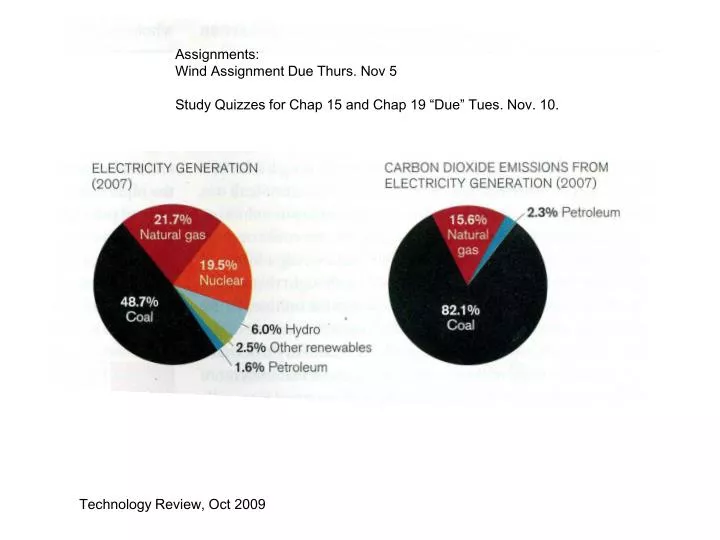
Assignments: Wind Assignment Due Thurs. Nov 5 Study Quizzes for Chap 15 and Chap 19 “Due” Tues. Nov. 10. Technology Review, Oct 2009
Chapter 19: Air Pollution and Noise Living and Working in a Healthy Environment
Sources of the 5 major pollutants in the U.S Note: Historically, the 6thMajor Pollutant was lead.
Source and Composition of Particulates meteoritic material soot sulfates, ash Soot, sulfates, VOCs soot sea salt Soot, organic methane, ammonia Soot, NOx, VOCs Minerals, clays
Texas Air Quality Let’s consider those compounds that the Federal Government regulates National Ambient Air Quality Standards (NAAQS) Secondary standard: Necessary to protect the public welfare and the environment The Clean Air Act requires these standards to be set at levels that protect public health with an adequate margin of safety and without consideration of cost. Primary standard: Necessary to protect the public health The light gray standards have been recently added.
Lecture 32 Texas Air Quality http://www.airnow.gov/index.cfm?action=airnow.national
U.S. Federal Regulation of Air Pollution • Air pollution Control Act of 1955 • Clean Air Act of 1963 • Amendment to CAA - Motor Vehicle Air pollution Control Act of 1965 • 1970 Clean Air Amendments and formation of the EPA. • 1975 catalytic converter developed.
Signs that regulation works! U.S. pollution trends since 1977
Types of SMOG 1.Industrial London Smog – combination of smoke and fog • At the end of the 1800’s, 40% less sunlight in London than surrounding towns • Health effects • Vitamin D deficiency, Rickets, Tubercolosis
2. Photochemical Smog • Consists mainly of secondary pollutants: Ozone (O3), NO2, VOCs Forms when sunlight induces chemical changes in gases and aerosols Causes poor visibility, burning eyes, sore lungs, worsen conditions of the heart and lungs, possible mortality.
Photochemical and Industrial Smog “London Smog or Industrial Smog” Gray-air in New York City “LA Smog”: Brown-air smog in Los Angeles © Dean D. Fetterolf/ShutterStock, Inc. © Chad Littlejohn/ShutterStock, Inc.
Photochemical Smog Ozone (O3) in the Troposphere Most problematic air pollutant in many areas of the U.S. Ozone is not directly emitted into the atmosphere, but instead forms through a complex series of reactions. It is largely because of this complexity that ozone is so difficult to control. I usually apologize for the excessive chemistry here, but explain that it’s impossible to discuss tropospheric ozone without it. Explain that hn simply indicates that a photon is absorbed by the molecule, which leads to decomposition (i.e., photolysis). The n is just frequency.
Ozone chemistry (gas-phase only) NO3 N2O5 hn O3 NO2 NO HNO3 HONO HO2 OH RO2 H2O H2O2 hn VOC This represents a simplistic overview of the gas phase reactions involved in ozone production. I highlight NOx and VOCs since these are the precursors that we can control.
The next two slides are meant to accompany a discussion of how emissions rates are measured. Measuring what comes out of a stack is pretty straightforward. Measuring the thousands of small leaks in a massive refinery such as those in Houston is more challenging. During TexAQS2000 aircraft measurements indicated that VOC emissions from many of the refineries in Houston far exceeded the reported values.
Measuring auto and truck emissions is usually accomplished by either putting the vehicle on a dynamometer and sampling the exhaust, or by sampling pollutant levels in tunnels. The Caldicott tunnel shown above (near San Francisco) has been used extensively for the latter type of study since it has two bores, one of which is used only by cars. This permits separation of the auto emissions from those from diesel trucks.
NOx and VOC sources in the Greater Houston Area The take-home message from these figures is that NOx is emitted almost entirely as a result of combustion, whereas VOC emissions are often dominated by other sources such as trees. The refineries and chemical plants in Houston are important sources of a range of VOCs.
This is called an ozone isopleth diagram, and shows the ozone concentration that will result from different NOx / VOC mixtures. The plot on the previous slide essentially represents a vertical line here.
This shows the number of exceedances in Houston over the past 9 years. Most high ozone days occur in the summer when there is plenty of sunlight to drive the photochemistry, warm temperatures accelerate some of the reactions, and temperature inversions often limit vertical mixing. After taking the lead in 1999 and 2000, Houston has dropped back below Los Angeles in the number of annual exceedences. The annual variability is caused primarily by meteorology.
19.2 The Effects of Climate and Topography on Air Pollution • Air pollution levels in a region are affected by a number of factors, among them: • Temperature • Sunlight • Wind • Other climate factors • They are also affected by the topography.
The Health Effects of Air Pollution FIGURE 6: Urban air pollution and incidence of emphysema in Winnipeg and St. Louis
Effects on Plants and Nonhuman Animals FIGURE 7: Trees killed by acid deposition in Pisgah Nation Forest, North Carolina © Jerry Whaley/age fotostock
19.5 Noise: The Forgotten Pollutant • Sound is characterized by loudness (measured in decibels) and pitch (how high or low it is).
Indoor Air Pollution FIGURE 14: Radon protection