Download
1 / 32
320 likes | 632 Views
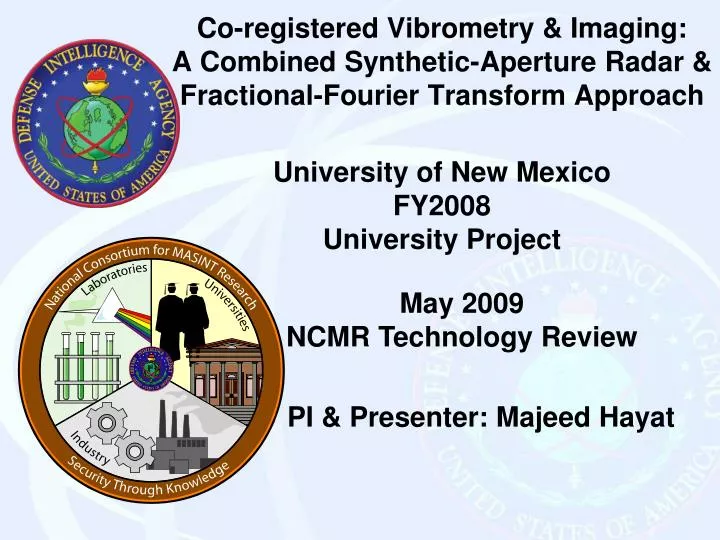
Co-registered Vibrometry & Imaging: A Combined Synthetic-Aperture Radar & Fractional-Fourier Transform Approach University of New Mexico FY2008 University Project. May 2009 NCMR Technology Review. PI & Presenter: Majeed Hayat. Project Information.

E N D
Co-registered Vibrometry & Imaging: A Combined Synthetic-Aperture Radar & Fractional-Fourier Transform ApproachUniversity of New MexicoFY2008University Project May 2009NCMR Technology Review PI & Presenter: Majeed Hayat
Project Information • Title of project: Co-registered Vibrometry and Imaging: A Combined Synthetic-Aperture Radar and Fractional-Fourier Transform Approach • Lead organization: University of New Mexico, Electrical & Computer Engineering Department • Project lead: Professor Majeed M. Hayat • Personnel: UNM Faculty: Prof. Majeed Hayat (ECE, 15%) Prof. Balu Santhanam (ECE,15%) Prof. Walter Gerstle (CIVIL Engr,15%) Sandia collaborators: Tom Atwood and Toby Townsend (10%) Graduate students: Qi Wang (50%) Srikanth Narravula (50%) Tong Xia (50)% Tom Baltis (25)% Post Doc: Matt Pepin (DOE funded)
Program Details • Date of award ($190,959 for FY08): Aug. 1, 2008 • Date of receipt of funds: Aug. 1, 2008 • Date work actually started: May 15, 2008 (via Pre-award) • Percent of FY-08 funds spent to date: ~80% • Percent of total work completed (over three year period) to date: ~33%
Project Narrative:Objectives • To exploit a powerful signal-processing tool, called the fractional Fourier transform, which is suitable for representing non-stationary signals, to design a novel synthetic-aperture radar imaging strategy that yields simultaneous imaging and vibrometry. • To test the new approach using both simulated and real SAR data; the latter may be provided by our collaborators at Sandia National Laboratories. • Tasks were revised in May 2008 to insure there is no duplication with newly awarded DoE award.
The returned signal after this step is: A/D LPF Quadrature term Step 3: Inverse Fourier transform in each dimension creates an image j 900 Resolution is limited by the bandwidth of the sent chirped microwave pulse and the size of the synthetic aperture LPF In-phase term Background: 2-D SAR process • The SAR signal is chirped in two dimensions: • in the u-dimension by the chirp pulse and • in the v-dimension by the change in range to the scatterer. Step 1: Deramp quadrature demodulation removes the u-chirp Step 2: Aperture compression and range compensation remove v-chirp
Previous Work: Non-stationary case • When the ground is vibrating the reflectance becomes time varying: • • The return signal after steps 1 & 2 becomes • Different processing is required to extract g(u,t) • To proceed, we need to specialize g(u,t) to practical forms
Analysis of Discrete Vibrating Points • By using the existing quadratic demodulation process and low-pass filtering, the return signal of each sent pulse becomes a superposition of chirp signals • Modulates the magnitude of each chirp • Linear dependence between and the pair [central frequency, chirp rate] • Need a method to measure the central frequency and chirp rate of each chirp signal simultaneously (FRFT) • We use the Fractional Fourier Transform and its discretization
Previous Work: Discrete FRFT The discrete fractional Fourier transform (DFRFT) has the capability to concentrate linear chirps in few coefficients MA-CDFRFT • Each “peak” relates to each target point • Position of each peak is related to position & velocity of point target
Previous Work: Vibration Identification Methodology Return echo quadratic demodulation & low-pass filtering (A/D) MA-CDFRFT Read out the positions of peaks Compute the central frequencies, and chirp rates Compute positions, and velocities Co-registration with traditional SAR imagery Vibrating Targets Est. position: FRFT/FT (actual) Est. reflectivity (actual) Est. velocity (actual) Target1 -39.4/-28.5 (-37.5) 0.78 (0.9) 945 (1000) Target2 1.27/6.5 (0) 0.42 (0.5) 472 (500) Target3 37.5/37.5 (37.5) 0.48 (0.5) 0 (0)
New Work: 2-D Non-stationary case • When the ground is vibrating the reflectance becomes time varying: • The return signal becomes • Different processing is required to extract g(u,v,t) • Practical forms: • Instantaneous velocity and sum of sinusoidal modes
Model for Discrete Vibrating Points • How can we estimate the motion of each discrete target? • Piece-wise linear approximation: • Send successive pulses to estimate • Pulse duration must be much shorter than vibrating period (at Nyquist rate) • Low frequency vibration measurement limited by maximum collection time • High frequency vibrations proportional to Doppler of single measurement instantaneous velocity
Single Look: Vibration Frequency and Direction Cross-Range Vibrating Target ϴ Range 0 Changing aperture splits vibration into two sin waves Complex amplitudes estimate vibration direction ᶿ Fit of V(t) cos envelope also estimates direction ᶿ Multi-Look
Single Look Approach Envelope Fit • Fitting the phase change envelope uses the slight change in amplitude of the vibration over the synthetic aperture • This method is least accurate around zero degrees when the vibration is directly aligned with the electromagnetic direction of propagation
Amplitude Modulation Multilook Approach :Frequency and Direction Estimates How to calculate at multiple look angles By taking two looks with different squint angles, the average energy ratio these two looks is The vibration direction can be resolved this way using multiple look angles and fitting the expected change in energy over the different squint angles to resolve the vibration direction Results:
Amplitude Modulation Amplitude Modulation Animated Demonstration The vibrating point target Θ The patch of ground
Summary: 2-D Methodology Return echo quadratic demodulation & low-pass filtering (A/D) MA-CDFRFT Read out the positions of peaks Compute the frequencies, chirp rates, positions, and velocities Estimate vibration frequencies and directions Form SAR image and overlay vibration information Multiple looks to measure and refine vibration direction
Enhancing Resolution via Non-uniform Frequency Sampling • DFRFT: DFT of the sequence zk[p]: • Non-uniform DFT: • Evaluates Z-transform at locations of interest in the set zk
Nonuniform Sampling: NDFT • Provides better peak resolution for larger in-band/out-band ratios (¼ 0.8-1). • Frequency domain samples can be concentrated around DFRFT peaks. • Sharper peak locations translate to better center-frequency & chirp-rate estimates.
Subspace Approach • DFRFT peak detection & chirp parameter estimation akin to DFT -- based sinusoidal frequency estimation: location of peak gives frequency estimate • Periodogram approach is statistically inconsistent. Subspace approaches yield asymptotically consistent estimates. • Covariance matrix of zk[p] is full-rank & eigenvalue spectrum not separable into S+N and N subspaces. • Subspace approach rank reduction needed.
Modeling Electromagnetic Wave Interactions with Vibrating Structures Monica Madrid (Ph.D. student)and Jamesina Simpson (Assistant Professor) Electrical and Computer Engineering Department, University of New Mexico Leveraging DOE Funding • Goals: • Construct full-Maxwell’s equations models of the interaction of specific synthetic aperture radar pulses with vibrating objects • Produce simulated Doppler shift information for single / multi-mode vibrating buildings encompassing a variety of geometrical and material features. • Methodology: • Employ the finite-difference time-domain (FDTD) method, a grid-based, wide-band computational technique of great robustness (~ 2,000 FDTD-related publications/year as of 2006, 27 commercial/proprietary FDTD software vendors)
FDTD Modeling Details • Model the structures using an advanced algorithm that accommodates both the surface perturbations1, as well as their internal density modulations2. • Perform a near-to-far-field (NTFF) transformation to obtain the unique signatures of vibrating objects as would be recorded by a remote antenna system. • Complete the model with the advanced convolutional perfectly matched layer (CPML) to terminate the grid and a total-field/scattered-field formulation (TFSF) to generate the plane wave illumination of objects. [1] A. Buerkle, K. Sarabandi, “Analysis of acousto-electromagnetic wave interaction using sheet boundary conditions and the finite-difference time-domain method,” IEEE TAP, 55(7), 2007. [2] A. Buerkle, K. Sarabandi, “Analysis of acousto-electromagnetic wave interaction using the finite-difference time-domain method,” IEEE TAP, 56(8), 2008.
Ongoing and Future FDTD Work • Current status and ongoing work: • We have implemented a 2-D FDTD model incorporating the CPML boundary conditions, NTFF transformation, TFSF formulation and surface vibrating perturbations. • Next steps will be to use the validated code to model a variety of structural geometries (rough surfaces, edges, corners) and materials (concrete, etc.), vibrating at specific modes as specified by the civil engineers on our team. • Future Work: • Extend the 2-D model to a fully 3-D simulation of synthetic aperture radar signals interacting with vibrating structures.
f(t) = F0 sin(Ωt) frictionless tube (A, L) k1 k2 m1 m2 gas (B, ρ, A) vibrating mass x L Modeling Vibrations and Physical Structures - Tests simulate theoretical model - A speaker simulates the vibrating mass m1 - An aluminum disk and two steel beams simulate the spring- mass system response - Matlab code controls the vibration frequency generating a sinusoidal excitation with well-controlled frequencies Acceleration Amplitude (m/s2) Forcing Frequencies (Hz)
Structural Acoustics Experiment Pressure transducer measures the pressure of a sound excitation. A steel box will simulate a room The speaker (inside the box) generates harmonic forces causing the box to vibrate. The transducer will measure the pressure of the sound, an accelerometer attached to the box will measure the acceleration of the walls
SAR Vibrometry Laboratory Planning • Simple laboratory for the experimental demonstration SAR-based vibrometry • Initial equipment concept complete • UNM Space allocated
Summary of Effort against Objectives • Side-by-side summary of the effort
Summary of Effort against Objectives • Side-by-side summary of the effort
Project Self-Assessment • Several 1D and 2D vibration estimation algorithms have been developed • A wide variety of vibrations may be estimated with range and cross-range methods • Two methods for estimating multiple vibration frequencies and angles completed • Signal processing method to improve vibration frequency resolution completed • Subspace methods to improve robustness to noise underway • Initial physical modeling of vibrating structures completed; Extension to more complex structures underway • Experimental testbed underway
Patents, Publications, and Experiments Associated with Project • Q. Wang, M. M. Hayat, B. Santhanam, and T. Atwood, “SAR Vibrometry using fractional-Fourier-transform processing,” SPIE Defense & Security Symposium: Radar Sensor Technology XIII (Conference DS304), Orlando, FL, April 2009. • B. Santhanam, S. L. Reddy, and M. M. Hayat, “Co-channel FM Demodulation Via the Multi Angle-Centered Discrete Fractional Fourier Transform,” 2009 IEEE Digital Signal Processing Workshop," Marcos Islands, Jan. 2009, FL, 2009. • M. Madrid, J. J. Simpson, B. Santhanam, W. Gerstle, T. Atwood, and M. M. Hayat, "Modeling electromagnetic wave interactions with vibrating structures," IEEE AP-S International Symposium and USNC/URSI National Radio Science Meeting, Charleston, SC, June 2009, accepted.
Summary • Phase history information in SAR data can be exploited via DFRFT-based signal processing to estimate vibrations while performing usual imaging • Vibration-axis ambiguities can resolved using a multiple-look approach combined with 2D analysis. • We have developed an understanding of the capabilities and limitations of the DFRFT based approach for SAR vibrometry • Additional validations are needed using simulations and experiments