Download
1 / 35
350 likes | 484 Views
The Precipitating Clouds Product of the Nowcasting SAF Anke Thoss, Ralf Bennartz*, Adam Dybbroe * University of Wisconsin, USA. Outline Introduction Method overview AVHRR AMSU combining AMSU and AVHRR algorithm performance Case Studies Summary and outlook.

E N D
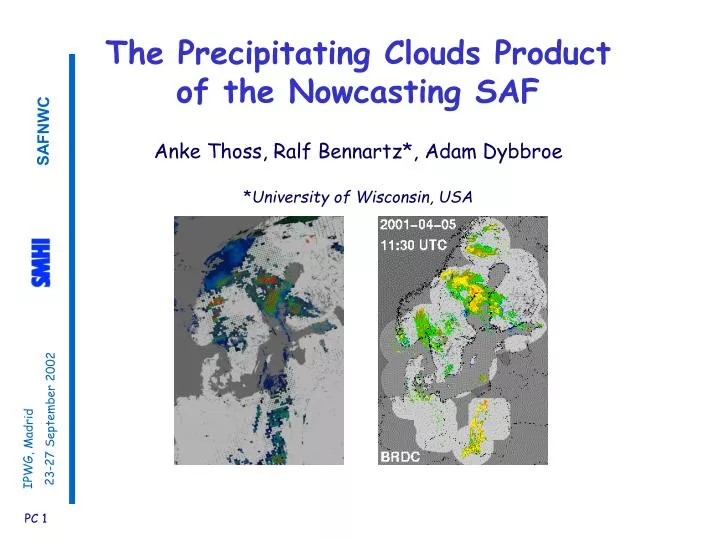
The Precipitating Clouds Product of the Nowcasting SAF Anke Thoss, Ralf Bennartz*, Adam Dybbroe *University of Wisconsin, USA
Outline • Introduction • Method overview • AVHRR • AMSU • combining AMSU and AVHRR • algorithm performance • Case Studies • Summary and outlook
Goal:Algorithm for Nowcasting applications • fast • absolute accuracy not of primary importance • applicable over land and sea, day and night • use satellite data directly received at weather service NOAA /(EPS): IR-VIS-MW MSG: IR-VIS • considerable uncertainties in both VIS/IR • as well as scattering based MW precipitation retrieval • likelihood estimates in intensity classes more appropriate
Four classes of precipitation intensity from co-located radar data Rain rate Class 0: Precipitation-free 0.0 - 0.1 mm/h Class 1: Very light precipitation 0.1 - 0.5 mm/h Class 2: Light/moderate precipitation 0.5 - 5.0 mm/h Class 3: Intensive precipitation 5.0 - ... mm/h
The data set • Eight months of NOAA-16 AMSU-A/B (Feb -Aug 2001, 867 overpaths) for AMSU algorithm development • 12 months (June 99 - May 00) for AVHRR algorithm development. • Co-located BALTEX-radar Data Centre radar data for the entire Baltic region, up to 30 radars, gauge adjusted
AMSU-A/B • cross track scanning microwave radiometer • spectral range 23-190 GHz, channels used:23 GHz, 89GHz, 150GHz • 3.3 degree resolution AMSU-A (23-89GHz) • 1.1 degree resolution AMSU-B (89-190GHz) • AVHRR • channels used: 0.6 m, 1.6 m 3.7 m, 11 m and 12 m • 1km resolution at nadir ( 0.054 degree )
AVHRR Algorithm development: • Based on Cloud type output • Correlation of spectral features with precipitation investigated • Special attention to cloud microphysics (day/night algorithms) • Precipitation Index PI constructed as linear combination of spectral features • Algorithms cloud type specific
very low clouds P(rain) = 2.1% low clouds P(rain) = 5.5% medium level P(rain) = 21.2% high opaque P(rain) = 38.9% very high opaque P(rain) = 47.0% Ci very thin P(rain) = 4.9% Ci thin P(rain) = 8.4% Ci thick P(rain) = 11.1% Ci over lower clouds P(rain) = 16.5% fractional clouds P(rain) = 3.5% Which Cloud types are potentially raining? all cloudfree types P(rain) < 2.6%
Correlation of Spectral features with rain Correlation with class, all potentially raining cloudtypes T11 -0.24 Tsurf - T11 0.26 T11-T11 -0.16 R0.6 0.18 R3.7 -0.18 ln(R0.6/R3.7) 0.26 R0.6/R0.6 0.42 3.7mday algorithm, all 0.35 1.6m day algorithm, all 0.44 night algorithm, all 0.30
Precipitation Index Example 3.7 day algorithm, all cloud types: PI=35+0.644(Tsurf-T11)+5.99(ln(R0.7/R3.7))-3.93(T11-T12) Example 1.6 day algorithm, all cloud types: PI = 65 -15*abs(4.45-R0.6 /R1.6)+0.495*R0.6-0.915(T11-T12) +0*Tsurf+0*T11
Probability distribution, all raining Cloudtypes Night algorithm 3.7 Day algorithm 1.6 Day algorithm
unprocessed cloud free land cloud free sea snow (land)snow/ice (sea)very low clouds very low clouds low clouds low clouds medium clouds medium clouds high opaque high opaque very high opaque very high opaque Ci, very thin Ci, thin Ci, thick Ci over lower cloud fractional cloud unclassified NOAA-15 overpass 27 May 2000 17:22 UT AVHRR Cloud type AVHRR-RGB CH 1,2,4 AVHRR-RGB CH 3,4,5
NOAA-15 overpass 27 May 2000 17:22 UT • AVHRR -day/night • Precipitation classification RGB: • blue: intensive • green: moderate • red: light • AVHRR -night • Precipitation classification RGB: • blue: intensive • green: moderate • red: light BALTRAD radar composite AVHRR-RGB CH 3,4,5
Passive microwave precipitation signal • Most directly linked to surface precipitation • Over cold (water) surfaces only • Works over both land and water surfaces • More indirect
The scattering index Predict brightness temperature T* in absence of scattering from low frequencies (functional relation is found by inverse radiative transfer modelling or global brightness temperature statistics) Take T* and subtract the observed high frequency brightness temperature Has been found to be a linear measure for precipitation intensity
For our algorithm: CORR corrects for scan position effects and statistical offset for non scattering situations AMSU-A water or coast, AMSU-B land: SI= T89-CORR -T150 AMSU-A land (and AMSU-B land): SI = T23-CORR -T150 AMSU-B water: SI = T89-CORR -T150 for SI water CORR is adjusted dynamically
AMSU-A Linear dependence of MW Tb’s on land fraction within FOV coastal estimates can be computed as a linear combination of land and sea estimate according to land fraction: SIcoast = (1-Nland)*SIsea + Nland*SIland T23 Nland important to properly convolve a high resolution LSM to the AMSU FOV important to properly convolve AMSU-B to AMSU-A for algorithm development: convolve radar to AMSU-B!
150 GHz versus 89 GHz scattering index over land, Results from NOAA15 (23GHz as low frequency channel)
Results hardclustering NOAA16 AMSU SEA %c0 %c1 %c2 %c3 radar c0 70 27 3 0 radar c1 15 53 31 1 radar c2 4 24 55 17 radar c3 3 6 27 64 AMSU Land %c0 %c1 %c2 %c3 radar c0 69 26 4 1 radar c1 16 49 24 11 radar c2 4 31 33 32 radar c3 10 5 14 71
NOAA-15 overpass 27 May 2000 17:22 UT • Precipitation classification RGB: • blue: intensive • green: moderate • red: lighPt AVHRR-RGB CH 3,4,5 AMSU-RGB 89,150,183±7 GHz BALTRAD radar composite
AVHRR AMSU + high spatial resolution - low spatial resolution + convective cells, even small - small convective cells ones can be well identified sometimes missed - no strong coupling between + stronger coupling between spectral signature and rain rain and scattering signature - area of potential rain + rain areas better delineated overestimated generally low likelihood - intensity and likelihood not + more independent intensity really decoupled and likelihood information - sometimes spurious light rain - not applicable over snow and ice
Combining AVHRR and AMSU AVHRR mainly used for QC of AMSU: run cloud type analysis for AVHRR pixels containing a potentially raining cloud type compute precipitation likelihood if total precipitation likelihood from AVHRR > 5%*, replace precipitation estimate with AMSU estimate (if available) over snow and sea ice use AVHRR only (to be implemented ) *thresholidng with a 5% likelihood from AVHRR has the effect that about 2.5% of the rain according to radar estimates for potentially raining clouds are missed.
NOAA-15 overpass 27 May 2000 17:22 UT • AVHRR -day/night • Precipitation classification RGB: • blue: intensive • green: moderate • red: light • AMSU/AVHRR • Precipitation classification RGB: • blue: intensive • green: moderate • red: light BALTRAD radar composite AVHRR-RGB CH 3,4,5
Algorithm performance Different algorithms - different characteristics to compare different algorithms: hardclustering performed with monthly varying, algorithm dependent thresholds. If P(rr) threshold, assign to rain class with greatest likelihood, otherwise assign to no-rain. Thresholds selected according to average monthly likelihood per class Total rain thresholds used:month 1 2 3 4 5 6 7 8 9 10 11 12 day3.7/ night 30 30 40 40 50 50 50 40 30 30 30 30 night 30 30 30 30 30 30 30 30 30 30 30 30 AMSU 30 40 40 50 50 50 50 40 50 50 40 40
Flexible clustering, potentially raining cloud types one year data set AVHRR day/night %c0 %c1 %c2 %c3 radar c0 57 2 35 6 radar c1 36 2 51 11 radar c2 18 2 59 21 radar c3 8 0 44 48 AVHRR night %c0 %c1 %c2 %c3 radar c0 71 1 28 0 radar c1 46 3 51 0 radar c2 28 2 69 1 radar c3 13 4 77 6 AMSU only Coastal %c0 %c1 %c2 %c3 radar c0 70 26 4 0 radar c1 24 42 29 5 radar c2 9 26 44 21 radar c3 5 8 26 61 AMSU/AVHRR %c0 %c1 %c2 %c3 radar c0 70 19 8 3 radar c1 46 3613 5 radar c2 27 38 23 12 radar c3 10 24 29 37 All year (120 scenes), every 30th pixel
Flexible clustering: correctly identified class0 (no rain)
Flexible clustering: class2 (0.5-5mm/h classified as rain)
Flexible clustering: class3 (>5mm/h classified as rain)
Flexible clustering, potentially raining cloud types April-May 2001 AVHRR day 1.6, rainthresh 20% %c0 %c1 %c2 %c3 radar c0 74 15 11 0 radar c1 45 34 21 0 radar c2 27 42 31 0 radar c3 16 43 41 0 AVHRR night, rainthresh 30% %c0 %c1 %c2 %c3 radar c0 63 1 36 0 radar c1 54 1 45 0 radar c2 39 1 60 0 radar c3 21 0 78 1 SCORES RAINTHRESH POD FAR HK HSS night 30% 0.53 0.63 0.16 0.11 day 1.6 20% 0.63 0.50 0.38 0.35 AMSU/AVHRR 20% 0.65 0.55 0.33 0.29 AMSU/AVHRR 50% 0.52 0.52 0.29 0.27 AMSU sea 0.89 0.83 0.47 0.17 AMSU land 0.88 0.75 0.57 0.27 AMSU/AVHRR, rainthresh 20% %c0 %c1 %c2 %c3 radar c0 68 24 6 2 radar c1 43 42 11 4 radar c2 25 42 22 11 radar c3 15 32 29 24 every 10th Pixel
Total rain likelihood 10% 20% 30% 40% 50% 60-80% 90-100% NOAA16, 2001-04-05, 11:30UTC upper: total precipitation likelihood, left:IR, middle:VIS,right:AMSU lower left: AMSU likelihood RGB Red:intensive green: light/moderate blue:very light lower right: BRDC radar composite
Total rain likelihood 10% 20% 30% 40% 50% 60-80% 90-100% NOAA16, 2001-04-23, 11:45UTC upper: total precipitation likelihood, left:IR, middle:VIS,right:AMSU lower left: AMSU likelihood RGB Red:intensive green: light/moderate blue:very light lower right: BRDC radar composite
Total rain likelihood 10% 20% 30% 40% 50% 60-80% 90-100% NOAA16, 2001-05-19, 10:45UTC upper: total precipitation likelihood, left:IR, middle:VIS,right:AMSU lower left: AMSU likelihood RGB Red:intensive green: light/moderate blue:very light lower right: BRDC radar composite
NOAA16, 2001-05-21, 14:000UTC 10% 20% 30% 40% 50% 60-80% 90-100% upper: total precipitation likelihood, left:IR, middle:VIS,right:AMSU lower left: AMSU likelihood RGB Red:intensive green: light/moderate blue:very light lower right: INM radar composite
Algorithm Performance - Summary all algorithms miss a lot of precipitation events in winter, but AMSU Alg. was recently improved on this point in summer generally acceptable performance, but area extend of precipitation overestimated. AVHRR 3.7 day algorithm can delineate moderate to strong precipitation,but assigns too many no rain cases high precipitation likelihood in summer AVHRR 1.6 day algorithm can delineate precipitation areas quite well, but can not delineate intensity. Seasonal and angular dependence needs to be investigated. AMSU highest potential to delineate intensity classes. Underestimates intensity when estimates are translated to pixel level (Scale!)
Outlook Check stability of 1.6um algorithm Develop combined 1.6, 3.9 m algorithm for MSG Refine coupling of VIS/IR/MW Calibrate MSG estimates with MW estimates?