Download

1 / 14
150 likes | 398 Views
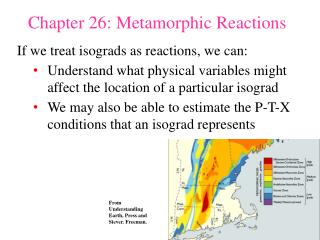
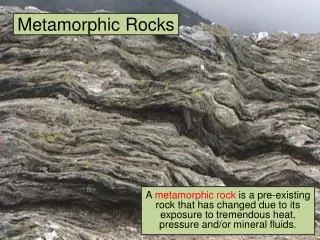
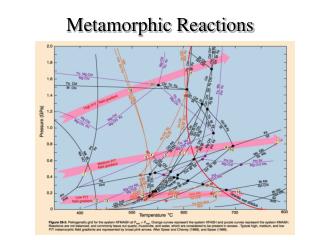
Metamorphic Reactions. Phase Transformation Reactions. dP = S. dT = V. Solid-Solid Net Transfer Reaction. NaAlSi 2 O 6 + SiO 2 = NaAlSi 3 O 8 Jd Qtz Ab. Clapyron Equation. dG = VdP – SdT. dP = S. dT = V.

E N D
dP = S dT = V Solid-Solid Net Transfer Reaction • NaAlSi2O6 + SiO2 = NaAlSi3O8 • Jd Qtz Ab Clapyron Equation dG = VdP – SdT
dP = S dT = V KAl3Si3O10(OH)2 + SiO2 = KAlSi3O8 + Al2SiO5 + H2O Ms Qtz Kfs Als Dehydration Reaction Slope of reaction boundary determined by properties of fluid phase Most dehydration reaction boundaries subparallel
Decarbonation Reactions CaCO3 + SiO2 = CaSiO3 + CO2 Parallelism of decarbonation reaction equilibrium boundaries in P-T space
dP = S dT = V Theoretical Loop of Devolatilization Reactions At high enough pressures the fluid phase is so compressed that VProducts < VReactants Clapyron equation becomes negative
Dehydration Reaction: Effect of PH2O < PTotal Le Chatelier’s principle; lowering PH2O stabilizes products at the expense of reactants, displacing equilibrium boundary to lower temperature Ln K = Ln fH2O ( fH2O = PH2O H2O)
Temperature vs Mole Fraction of Fluid Species T-XH2O Diagram T-XCO2 Diagram XCO2 + XH2O = 1
P3 P2 P1 T (A) P3 P2 (S) P1 (K) T Energy-Temperature Diagrams: the Rules of Schreinemakers P1 G K A S T P3 G K A S T P2 G K A S T
Rules of Schreinemakers • Label each reaction with the missing phase • Arrange reactions such that the label is stable where the reaction is metastable
Application of Rules of Schreinemakers to 2-component system with 4 phases Note that there is one reaction for each phase in the system
Application of Rules of Schreinemakers to 2-Component System with 5 phases
An Example of a Petrogenetic Grid – the KMASH System for Pelites