Download
1 / 17
170 likes | 278 Views
A Climatology of the Convective System Morphology over Northeast United States Kelly Lombardo & Brian Colle School of Marine and Atmospheric Sciences Stony Brook University. (m). dBZ. Convective Structures IC: Isolated Cells CC: Cluster of Cells BL: Broken Line NS: No Stratiform

E N D
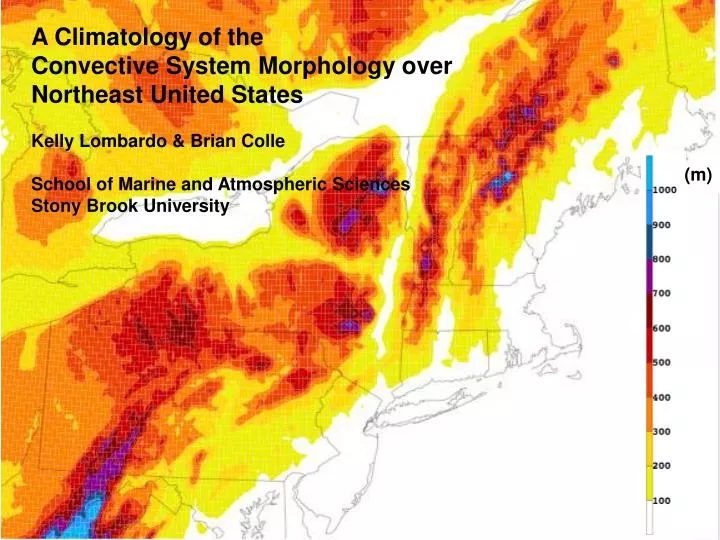
A Climatology of the Convective System Morphology over Northeast United States Kelly Lombardo & Brian Colle School of Marine and Atmospheric Sciences Stony Brook University (m)
dBZ Convective Structures IC: Isolated Cells CC: Cluster of Cells BL: Broken Line NS: No Stratiform TS: Trailing Stratiform PS: Parallel Stratiform LS: Leading Statiform BE: Bow Echo NL: Nonlinear >60 50-60 40-50 30-40 <30 (Gallus et al. 2008)
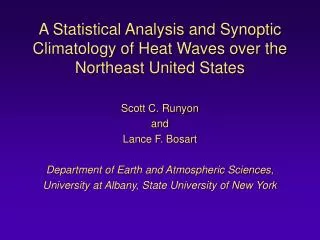
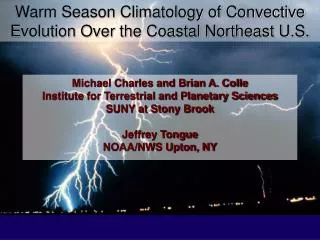
Motivational Questions What are the convective structures across the NE and how do they compare to the Central US? What is the evolution of the convective types across the domain? Are there specific ambient conditions that favor each type? Is there a preferred type of severe weather associated with these structures ? 070803 1530 UTC – 070804 0800 UTC
Data & Methods • Examined 2 km NOWrad (available from NCAR) every 15 minutes from May-August 2007. • Identified the structure of convection across the Northeast U.S., matching the structures defined by Gallus et al. 2008. • Noted the time and location of initiation and decay for each structure. • Multiple structures can exist across the entire domain. All were cataloged.
Structural Distribution Central Plains (Gallus et al. 2008) 925 events +24 LS & PS (Parker and Johnson 2000) Northeast 454 events
Where do the convective types initiate? Methodology: *Noted domain & time of initiation. *Binned the times into 6 hr increments: 00-06 UTC, 06-12 UTC, 12-18 UTC, 18-00 UTC. *Normalized to account for variations in domain size. Upslope 18% High Terrain 34% East Slope & Coastal Plain 24% Coastal Ocean 24%
Types of Evolutions • Upscale growth from cellular to linear and/or nonlinear systems. • Cellular with no upscale growth. • MCS propagating into the region from upstream. • Embedded convection within widespread precipitation and banding features associated with baroclinic systems. • Example of upscale growth…
070627 1700 UTC 070627 2000 UTC 070627 2115 UTC Cluster of Cells No Stratiform Bow Echo 070627 2245 UTC 070628 0100 UTC 070628 0300 UTC Trailing Stratiform Trailing Stratiform Nonlinear
June 27 2007 Transition Event Surface Analysis Sounding KALB 070627 1200 UTC CAPE 1154 Jkg-1 400 hPa 500 hPa 600 hPa 700 hPa 900 hPa 070627 1800 UTC
Composite of Transition Events: Included 17 events Selected at random from May-August, 2005-2007 20 km RUC analyses Closest time within 3 hrs prior to the first sign of cellular convection 070627 event was excluded from the composite mean sea level pressure (blue solid), surface thte (K, green dashed), surface wind (ms-1), CAPE (Jkg-1, shaded)
Composite of Transition Events 700 hPa hght (blue contours), 700 hPa relative vorticity (*10-5 s-1, black dashed contours), 300 hPa mag wind (ms-1, shaded) 850 hPa hght (blue contours), 850 hPa wind (ms-1), 850 hPa thte (K, shaded), 850 hPa tmpc (light blue dashed)
What convective type is associated with the most severe wind reports? Methodology: *SPC svr storm report archive. *Noted the time and lat/lon point of each individual storm report. *Examined NOWrad data for that time. *Noted the structure of precip at lat/lon point of svr wx report. *That convective structure was responsible for that svr wx report. *Normalized by the total number of events. (Gallus et al. 2008) IC: Isolated Cells CC: Cluster of Cells BL: Broken Line NS: No Stratiform TS: Trailing Stratiform PS: Parallel Stratiform LS: Leading Statiform BE: Bow Echo NL: Nonlinear IC CC BL NL NS TS LS PS BE Number of svr wind reports per event Trailing Stratiform 070609:0000 IC CC BL NL NS TS LS PS BE
Clusters of Cells 070713:2045 What convective type is associated with the most hail reports? (Gallus et al. 2008) IC CC BL NL NS TS LS PS BE Broken Line 070510:1800
What convective type is associated with the most tornado reports? Bow Echo 070809:1530 (Gallus et al. 2008) IC CC BL NL NS TS LS PS BE Nonlinear 070808:1015
Summary • Northeast U.S. has a similar distribution of different convective structures as the Central Plains, perhaps more clusters of convection over the NE. • Convective initiation (IC, CC, NL) begins in the UP & HT regions early in the day, peaking 18–00 UTC. This initiation shifts eastward to the coast & becomes more linear/NL later in the day. • Transition events (isolated cell to linear) have moderate instability, westerly flow, weak shear & weak synoptic forcing. • TS systems are associated with the largest number of severe wind reports per event in the NE, but the largest number of tornados per event are produced by BE. Future Work • Include more warm season events in climatology. • Obtain a better understanding of the reasons for the convective evolution and structures over the NE.