Download
1 / 22
220 likes | 304 Views
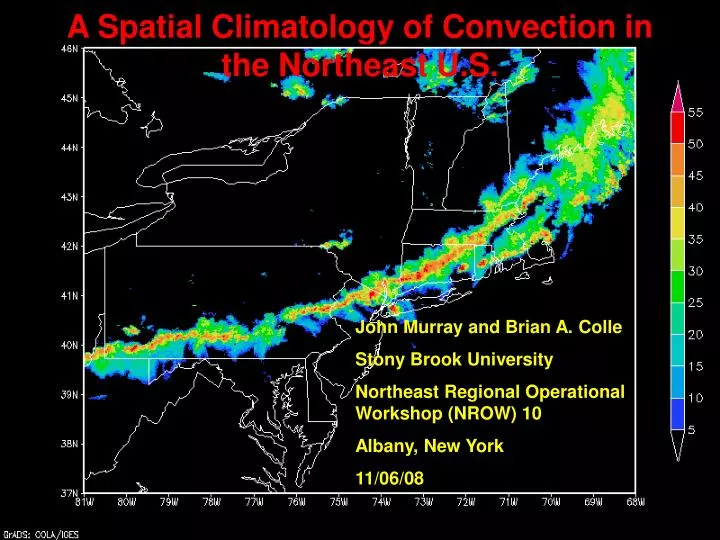
A Spatial Climatology of Convection in the Northeast U.S. . John Murray and Brian A. Colle Stony Brook University Northeast Regional Operational Workshop (NROW) 10 Albany, New York 11/06/08. Motivation.

E N D
A Spatial Climatology of Convection in the Northeast U.S. John Murray and Brian A. Colle Stony Brook University Northeast Regional Operational Workshop (NROW) 10 Albany, New York 11/06/08
Motivation • There is little understanding of the spatial distribution of convection over the Northeast U.S. and the relationship with different geographical features. • How do the preferred regions for convective activity over the Northeast vary diurnally and during the warm season? • How does convection evolve around terrain, coastal geometry, and urban areas? • What are the different flow patterns associated with the convective maximum and minimum areas across the Northeast?
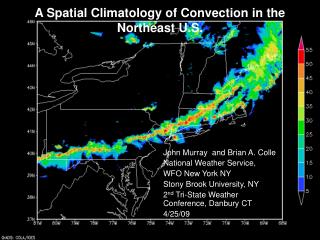
Observational Datasets and Approach • Cloud to Ground Lightning Data National Lightning Detection Network (NLDN) • Available 2000-2007 • Interpolated to a 10x10 km grid centered over the Northeast U.S. • NOWrad (WSI NCAR): WSR-88D • Use NOWrad every 2x2 km2 at 15 minute interval (largest reflectivity at a point from surrounding radars) • Composite from April through September 1996-2007 by counting frequency of reflectivity exceeding a threshold (45 dBZ for this study unless otherwise mentioned) WSR 88D coverage at 3km above MSL, from Maddox et al 2002 Figure from thunder.msfc.noaa.gov
Radar Composites compared with cloud to ground lightning data • For 2001-2007: • 30 months included between May and September • May missing for 2001, 2003, June missing in 2003, September missing for 2006, 2007
1 5 4 3 2
2 3 1 4 5
NARR composite of CAPE every 3 hours during Convective Days over the Northeast
North American Regional Reanalysis (NARR) to relate wind regimes nearest to time of convection • NOWrad convective frequencies + or – 1 hr around each NARR time were used to depict frequencies with different flow regimes • Flow regimes defined at 500 hPa: WNW->W(271-315), WSW->SSW(270-225). • Flow regimes defined at 925 hPa: SSW->SSE(225-135), WNW->WSW(315-225). For 925 hPa For 500 hPa X X X X X X X X
Making wind regimes at 500 hPa SW->W (226-270), W->NW (271-315)
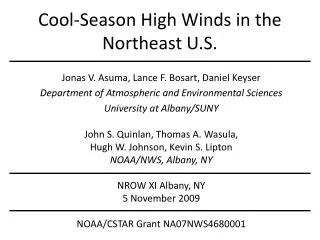
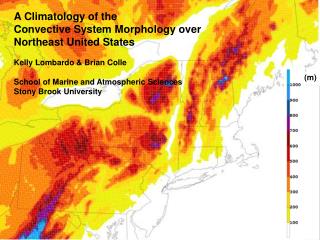
Summary • Convection (≥ 45dBZ) varies across the region, with localized maxima across western PA, Hudson Valley, and along the coastal plain from VA to NJ. There is a relatively sharp decrease in convection at the coast. • Convection is a maximum over inland locations during the day, and this maximum moves to the coastal ocean by the late night. • Inland convection reaches a maximum in July, with more convection situated over the coastal waters during August as the SSTs warm. • Convection is most frequent over inland locations with SW-W flow at 500mb. Southerly flow at 925mb results in a greater influx of marine air into southern New England resulting in a larger gradient of convective frequency from land to coast.
Future Work • How do convective systems evolve across the Northeast spatially? • - Use hovmoller diagrams to show convection moving across the Appalachians • How does the marine boundary layer affect convective evolution? • Choose points and center domain across eastern Long Island and Cape Cod • Compare different distributions of convection with wind regime like for the Hudson Valley • Quantify convection that strengthens and weakens • What is the distribution of convective intensity across the Northeast? • Distribution of reflectivity (40, 50, 55, 60 dBZ) across domain • Max reflectivity at each point • What are the large scale and local ambient conditions associated with severe weather? • - Days in which severe weather was reported or warned for will be compared to the overall climatology
Acknowledgments • Dr. Matthew Parker, North Carolina State University – assistance with the NOWrad data • National Science Foundation • ATM-0705036