Download
1 / 68
680 likes | 796 Views
Problem Set 9/10--Part 1: Question 1.

E N D
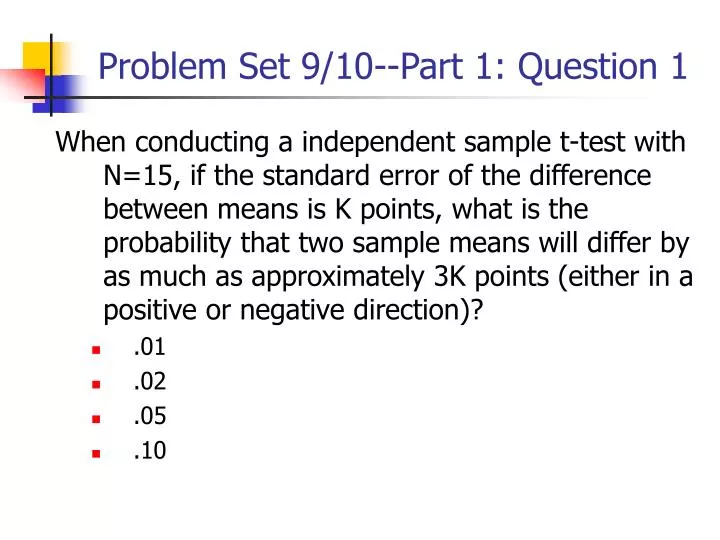
Problem Set 9/10--Part 1: Question 1 When conducting a independent sample t-test with N=15, if the standard error of the difference between means is K points, what is the probability that two sample means will differ by as much as approximately 3K points (either in a positive or negative direction)? • .01 • .02 • .05 • .10
H0 Problem Set 9/10--Part 1: Question 2 A researcher set a = .05, and carried out 20 independent t-tests. By chance alone, how many statistically significant t-tests would be expected if H0 were true in each of the 20 situations? • 0 • 1 • 3 • 6 • > 10
Problem Set 9/10--Part 1: Question 3 If the observed t-ratio for a mean difference is approximately 0, one would conclude that • the two populations have equal means • no convincing evidence for a difference has been found • the measures used have little or no validity • the sample sizes are too small
Problem Set 9/10--Part 2: Problem 1 In the variable view, type in the independent variable in one row and the dependent variable in another row
Problem Set 9/10--Part 2: Problem 1 In this problem, we enter 12 zeros to represent the candy bar group, and 12 1’s to represent the no-candy bar group Remember to enter value labels in the Variable View for the categorical variables
Problem Set 9/10--Part 2: Problem 1 Analyze >> Compare means >> Independent Samples T test
Problem Set 9/10--Part 2: Problem 1 Move the independent variable into the “grouping variable” field …and don’t forget to define the groups.
Problem Set 9/10--Part 2: Problem 1 Move the dependent variable into the “test variable” field
Dependent samples t-test. • What if you violate the assumption of independence of samples? • Then you must conduct a paired-samples t-test. • -dependent samples t-test • -repeated measures t-test • -correlated samples t-test
Dependent Situations. • Same person tested two times. (repeated measure; pretest-posttest) • Two people who have a relationship with one another. (correlated) • e.g., brothers, sisters, twin, spouse • Two people who have something in common that might also effect the dependent variable. (matched) • e.g., same IQ, same grade level, same SES
Differences from Independent Sample t-test. • Statistical Hypotheses: stay the same Nondirectional Ho: µ1 - µ2 = 0 HA: µ1 - µ2 ≠ 0 You may also see… Ho: µB = 0 HA: µB ≠ 0
Differences from Independent Sample t-test. • Statistical Hypotheses: stay the same • Assumptions: • The sample of paired observations is randomly sampled. • Both sets of observations are normally distributed in the population with the same variance. • NO ASSUMPTION of INDEPENDENT SAMPLES
Test statistic. The mean of the difference scores (D). Standard deviation of paired differences. The standard error of the mean of paired differences. Number of pairs of scores.
Calculating SD • Example – Dependent Samples T Test Pre-testPost-test D • 50 30 20 • 40 50 -10 • 30 30 0 • N=3 (# of pairs of scores) • To calculate SD, use the D scores…
Critical Values. • For testing the null against the alternate the critical value is as follows: • select your alpha • Select directional or non-directional • look up in t-table using degrees of freedom N – 1 where N is the number of pairs of scores
The standard error of the mean of the differences. • The formula for this standard error is different from the one that we used in the independent samples t-test. • We now include a value that represents how “dependent” or “related” the two sets of scores are. • If they are highly related then we should be able to reduce the expected differences by chance alone…that’s a reduction in our standard error.
Correlation coefficient. • A correlation coefficient is a value that represents the relationship between two continuous variables. • Values range from -1.00 to +1.00. • The closer the value is to 0.00, the weaker the relationship between the two variables. • If it is close to +1.00 then there is a strong positive relationship between the two variables. • If it is close to -1.00 then there is a strong negative relationship between the two variables.
See In-class Exercise: In class Dependent Samples t-test Located in Course Materials
In class exercise: Dependent Samples t-test – Question #1 • Steps to complete a dependent sample t-test: 1. Set up null and alternate hypothesis. H0: H1: -2.262 +2.262
In class exercise: Dependent Samples t-test • Steps to complete a dependent sample t-test:
In class exercise: Dependent Samples t-test • Steps to complete a dependent sample t-test: 6. Calculate observed t-statistic.
In class exercise: Dependent Samples t-test • Steps to complete a dependent sample t-test: 6. Calculate observed t-statistic. z-obs = 2.69 -2.262 +2.262 Reject the null hypothesis
In class exercise: Dependent Samples t-test • Steps to complete a dependent sample t-test: 7. Calculate the confidence interval 95% Confidence interval = Reject the null hypothesis
In class exercise: Dependent Samples t-test – Question #2 • Steps to complete a dependent sample t-test: 1. Set up null and alternate hypothesis. Or…
In class exercise: Dependent Samples t-test • Steps to complete a dependent sample t-test: 1. Set up null and alternate hypothesis. Df=9; α=.05 -2.262 +2.262
In class exercise: Dependent Samples t-test • Steps to complete a dependent sample t-test:
In class exercise: Dependent Samples t-test • Steps to complete a dependent sample t-test: • 6. Calculate observed t-statistic.
In class exercise: Dependent Samples t-test • Steps to complete a dependent sample t-test: • 6. Calculate observed t-statistic. z-obs = -1.00 Fail to reject the null hypothesis
In class exercise: Dependent Samples t-test • Steps to complete a dependent sample t-test: • 8. Calculate the confidence interval 95% Confidence interval = Fail to reject the null hypothesis
In class exercise: Dependent Samples t-test – Question #3 • Steps to complete a dependent sample t-test: 1. Set up null and alternate hypothesis.
In class exercise: Dependent Samples t-test • Steps to complete a dependent sample t-test: 1. Set up null and alternate hypothesis. Df=9; α=.05 H1 H1 H0 -2.262 +2.262
Matching Data These scores came from two individuals who both had an IQ of 110, but one gets the collaborative learning and the other gets traditional learning.
In class exercise: Dependent Samples t-test • Steps to complete a dependent sample t-test:
In class exercise: Dependent Samples t-test H1 H1 H0 z-obs = 2.34 -2.262 +2.262 Reject the null hypothesis
In class exercise: Dependent Samples t-test Variance of D Standard deviation of D Standard Error of D
Dependent Sample t-test on SPSS Unlike the independent sample t-test, for the dependent sample t-test we put each group into a separate column, with matching scores in the same row. There is no column for a grouping variable.
Dependent Sample t-test on SPSS Analyze… Compare Means… Paired-Samples T Test.
Dependent Sample t-test on SPSS Standard deviation for each individual variable. Standard error of the mean for each individual variable. This is not the standard error for the dependent sample t-test.
Dependent Sample t-test on SPSS The correlation is the measure of dependency between the two sets of scores. It is only calculated for the dependent sample t-test. The larger the absolute value, the stronger the dependency. Remember, correlations range from -1.00 to +1.00.
sD sD Dependent Sample t-test on SPSS df = # of pairs - 1 2-tailed p value Compare this to alpha tobs = 2.100 .78
H1 H1 H0 -2.689 +2.689 -2.262 +2.262 Dependent Sample t-test on SPSS The green area is your p-value and it would total .025.
Dependent Sample t-test on SPSS Check to see if 0 falls in this interval. If 0 is in the interval, we Fail to Reject the Null Hypothesis If 0 is NOT in the interval, we Reject the Null Hypothesis
Writing up the Dependent Sample t-test (continued) • What to include: • Research hypothesis being tested in terms of the independent and dependent variables. • The type of test conducted, including directional/non-directional • Alpha level • Reject or Fail to Reject (including a statement of the null hypothesis) • The statistical results to support your decision, including the degrees of freedom, observed statistic, and p-value. • Conclusion about a significant difference or no • Include sample statistics for groups here. • Confidence Interval (if you are conducting a non-directional test). • Correlation between the two samples of scores.
Output for Problem #2 Descriptive statistics for the two samples. Correlation represents whether there is a dependency. Information for deciding to reject or fail to reject
Making a decision in Problem #2 • Fail to Reject the Null Hypothesis • two tailed significance was greater than alpha • the value of 0 fell within the confidence interval