Download
1 / 1
10 likes | 162 Views
Statistical Group Differences in Anatomical Shape Analysis using Hotelling T 2 metric. National Alliance for Medical Image Computing. Martin Styner 1,2 , Ipek Oguz 1,2 , Shun Xu 1,2 , Dimitrios Pantazis 3 , Guido Gerig 1,2

E N D
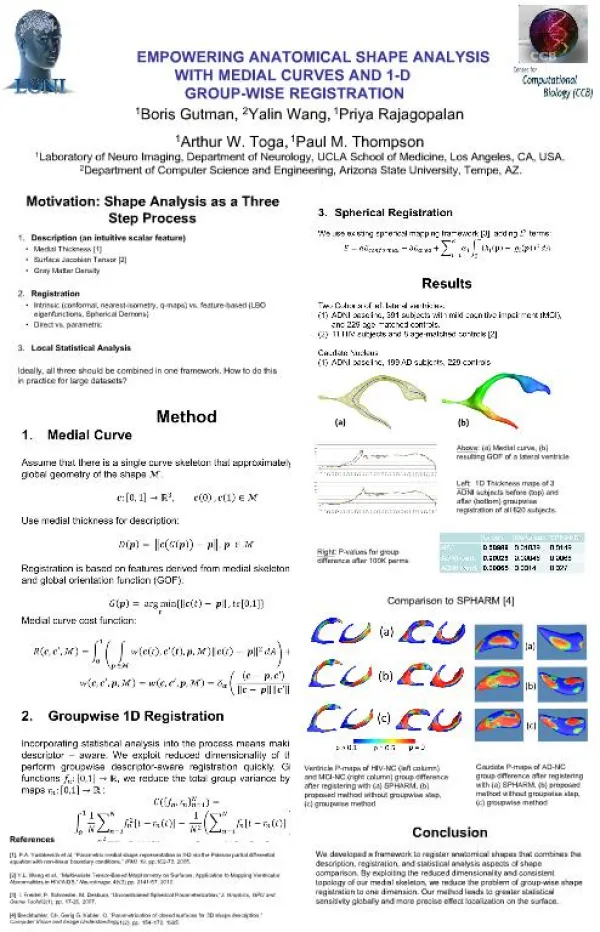
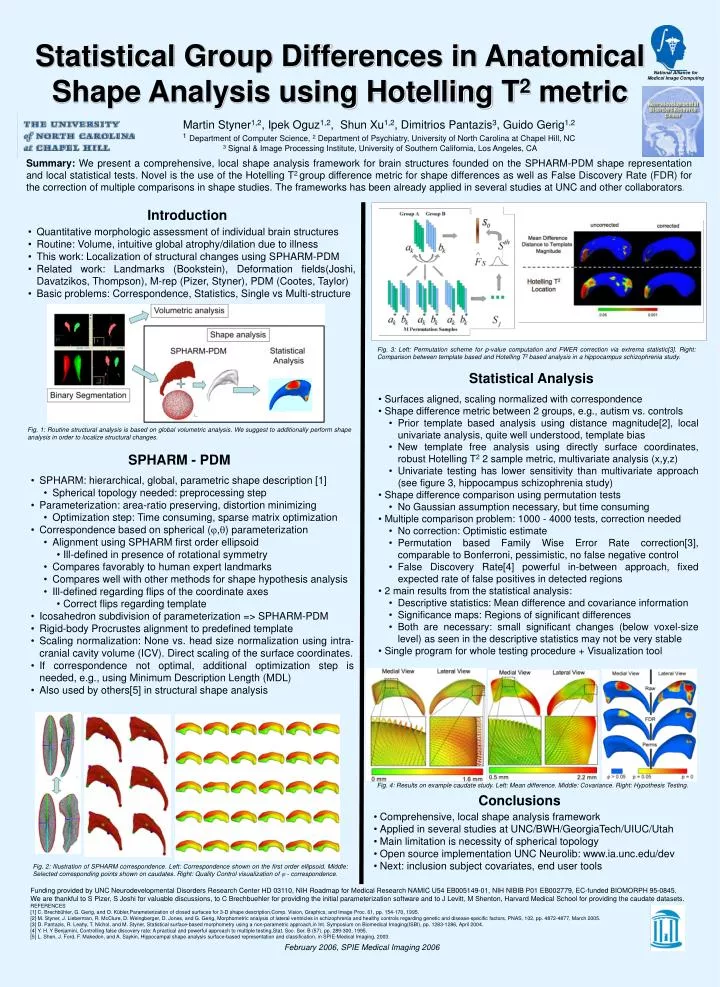
Statistical Group Differences in Anatomical Shape Analysis using Hotelling T2 metric National Alliance for Medical Image Computing Martin Styner1,2, Ipek Oguz1,2, Shun Xu1,2, Dimitrios Pantazis3, Guido Gerig1,2 1Department of Computer Science, 2 Department of Psychiatry, University of North Carolina at Chapel Hill, NC 3Signal & Image Processing Institute, University of Southern California, Los Angeles, CA Summary: We present a comprehensive, local shape analysis framework for brain structures founded on the SPHARM-PDM shape representation and local statistical tests. Novel is the use of the Hotelling T2 group difference metric for shape differences as well as False Discovery Rate (FDR) for the correction of multiple comparisons in shape studies. The frameworks has been already applied in several studies at UNC and other collaborators. Introduction • Quantitative morphologic assessment of individual brain structures • Routine: Volume, intuitive global atrophy/dilation due to illness • This work: Localization of structural changes using SPHARM-PDM • Related work: Landmarks (Bookstein), Deformation fields(Joshi, Davatzikos, Thompson), M-rep (Pizer, Styner), PDM (Cootes, Taylor) • Basic problems: Correspondence, Statistics, Single vs Multi-structure Fig. 3: Left: Permutation scheme for p-value computation and FWER correction via extrema statistic[3]. Right: Comparison between template based and Hotelling T2 based analysis in a hippocampus schizophrenia study. Statistical Analysis • Surfaces aligned, scaling normalized with correspondence • Shape difference metric between 2 groups, e.g., autism vs. controls • Prior template based analysis using distance magnitude[2], local univariate analysis, quite well understood, template bias • New template free analysis using directly surface coordinates, robust Hotelling T2 2 sample metric, multivariate analysis (x,y,z) • Univariate testing has lower sensitivity than multivariate approach (see figure 3, hippocampus schizophrenia study) • Shape difference comparison using permutation tests • No Gaussian assumption necessary, but time consuming • Multiple comparison problem: 1000 - 4000 tests, correction needed • No correction: Optimistic estimate • Permutation based Family Wise Error Rate correction[3], comparable to Bonferroni, pessimistic, no false negative control • False Discovery Rate[4] powerful in-between approach, fixed expected rate of false positives in detected regions • 2 main results from the statistical analysis: • Descriptive statistics: Mean difference and covariance information • Significance maps: Regions of significant differences • Both are necessary: small significant changes (below voxel-size level) as seen in the descriptive statistics may not be very stable • Single program for whole testing procedure + Visualization tool Fig. 1: Routine structural analysis is based on global volumetric analysis. We suggest to additionally perform shape analysis in order to localize structural changes. SPHARM - PDM • SPHARM: hierarchical, global, parametric shape description [1] • Spherical topology needed: preprocessing step • Parameterization: area-ratio preserving, distortion minimizing • Optimization step: Time consuming, sparse matrix optimization • Correspondence based on spherical (,) parameterization • Alignment using SPHARM first order ellipsoid • Ill-defined in presence of rotational symmetry • Compares favorably to human expert landmarks • Compares well with other methods for shape hypothesis analysis • Ill-defined regarding flips of the coordinate axes • Correct flips regarding template • Icosahedron subdivision of parameterization => SPHARM-PDM • Rigid-body Procrustes alignment to predefined template • Scaling normalization: None vs. head size normalization using intra-cranial cavity volume (ICV). Direct scaling of the surface coordinates. • If correspondence not optimal, additional optimization step is needed, e.g., using Minimum Description Length (MDL) • Also used by others[5] in structural shape analysis Fig. 4: Results on example caudate study. Left: Mean difference. Middle: Covariance. Right: Hypothesis Testing. Conclusions • Comprehensive, local shape analysis framework • Applied in several studies at UNC/BWH/GeorgiaTech/UIUC/Utah • Main limitation is necessity of spherical topology • Open source implementation UNC Neurolib: www.ia.unc.edu/dev • Next: inclusion subject covariates, end user tools Fig. 2: Illustration of SPHARM correspondence. Left: Correspondence shown on the first order ellipsoid. Middle: Selected corresponding points shown on caudates. Right: Quality Control visualization of - correspondence. Funding provided by UNC Neurodevelopmental Disorders Research Center HD 03110, NIH Roadmap for Medical Research NAMIC U54 EB005149-01, NIH NIBIB P01 EB002779, EC-funded BIOMORPH 95-0845.We are thankful to S Pizer, S Joshi for valuable discussions, to C Brechbuehler for providing the initial parameterization software and to J Levitt, M Shenton, Harvard Medical School for providing the caudate datasets. REFERENCES [1] C. Brechbühler, G. Gerig, and O. Kübler,Parameterization of closed surfaces for 3-D shape description,Comp. Vision, Graphics, and Image Proc. 61, pp. 154-170, 1995. [2] M. Styner, J. Lieberman, R. McClure, D. Weingberger, D. Jones, and G. Gerig, Morphometric analysis of lateral ventricles in schizophrenia and healthy controls regarding genetic and disease-specific factors, PNAS, 102, pp. 4872-4877, March 2005. [3] D. Pantazis, R. Leahy, T. Nichol, and M. Styner, Statistical surface-based morphometry using a non-parametric approach,in Int. Symposium on Biomedical Imaging(ISBI), pp. 1283-1286, April 2004. [4] Y. H. Y Benjamini, Controlling false discovery rate: A practical and powerful approach to multiple testing,Stat. Soc. Ser. B (57), pp. 289-300, 1995. [5] L. Shen, J. Ford, F. Makedon, and A. Saykin, Hippocampal shape analysis surface-based representation and classification, in SPIE-Medical Imaging, 2003. February 2006, SPIE Medical Imaging 2006