Download
1 / 46
460 likes | 463 Views
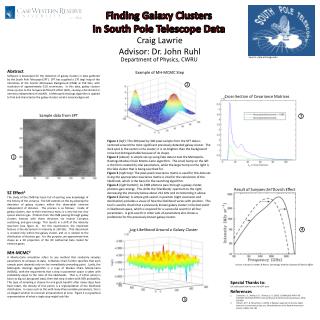
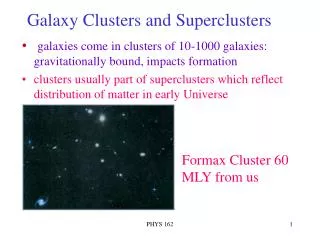
This article explores the use of simulations to refine methods for finding galaxy clusters, focusing on weak lensing and the Sunyaev-Zel'dovich effect. The author discusses the challenges of cluster finding and the implications for follow-up observations.

E N D
Finding Galaxy Clusters in Simulation and Reality Martin White Department of Physics Department of Astronomy UC Berkeley Lawrence Berkeley National Lab
Outline Using simulations to refine our methods for … • Finding clusters • Weak lensing • Sunyaev-Zel’dovich • Galaxy surveys (& our 2MASS experience) • Making a mass selected sample (?!) • Is this the right goal?! • What do we mean by “the mass”?
Using all the mass to find clusters of galaxies …weak gravitational lensing
Weak lensing: the good news • Measures (approximately) the projected mass along the line of sight, weighted by a simple kernel.
Weak lensing: the good news (contd) • Can find mass concentrations, even if the cluster is dark! • Independent of assumptions of the dynamical state of the cluster. • The “best” way to find clusters?! Lensing is the perfect problem for N-body simulations. (Requires relatively low resolution)
Weak lensing: the bad news • Measures (approximately) the projected mass along the line of sight, weighted by a simple kernel. • Kernel changes by < 1% over > 100Mpc. • The universe’s worst confusion problem!
Clusters are part of large-scale structure Metzler, White & Loken (2001)
Confusion leads to low efficiency • Large-scale structure along the line-of-sight leads to a large scatter between mass and lensing signal. • Combine • Large scatter in your mass estimator and • A steeply falling mass function • and you get … • Most of your candidates are actually low mass groups “scattered” into your sample. If nothing else, this makes follow up observations very expensive.
Implications … • You can find clusters using weak lensing! • For “standard” filters cluster finding is dramatically affected by line-of-sight projection. • “Noise” from random superpositions of large-scale structure comparable to signal from a cluster of 1014 Msun at z ~ 0.5. • High completeness requires high contamination. • What about multiple source populations, matched filters or cross-correlation? (Padmanabhan, Seljak & Pen, 2003; Bacon, Taylor & White, in prep)
The Sunyaev-Zel’dovich effect(s) • Compton scattering of CMB photons by hot gas along line-of-sight. • Upscattering of CMB photons leads to ~mK temperature decrements in CMB at low frequency. • Like lensing, but weighting by temperature. • Signal dominated by clusters of galaxies. • Measures total internal energy of cluster. • Independent of redshift!
Simulation programme … with Volker Springel & Lars Hernquist • The SZ effect is the “best” problem for numerical hydrodynamics. • Series of simulations designed to study SZE • Adiabatic hydrodynamics • Box size, particle number, force softening. • Artificial pre-heating • Cooling only • Cooling and feedback (and winds)
What have we learned? • Effect is dominated by “sources”. • Most of the effect comes from gas at overdensities O (102) times the mean density. • Significant Y-M scatter. • Cooling and feedback are small effects.
Probing massive halos … Sources found with Sextractor Typical size ~1´ 1o
What have we learned? • Effect is dominated by “sources”. • Most of the effect comes from gas at overdensities O (102) times the mean density. • Significant Y-M scatter. • Cooling and feedback are small effects.
SZ projection effects … Y~M x T ~M5/3 Effect is indep. of distance! c.f. weak lensing or richness
What have we learned? • Effect is dominated by “sources”. • Most of the effect comes from gas at overdensities O (102) times the mean density. • Significant Y-M scatter. • Cooling and feedback are small effects.
Insensitive to “extra” physics Heating or cooling alone can cause big shifts, but when combined in a self- consistent model …
Finding clusters with SZ • Primary CMB anisotropies are a major contaminant for cluster searches, but smooth on the scale of clusters. • Use a (hi-pass) compensated filter to suppress slowly varying background. • Use a (lo-pass) smoothing filter to suppress noise. • BUT … when the source density is high, want to avoid filters which are narrow in Fourier space … they “ring” in real space. • Difficult optimization problem! • We know the spectrum of signal and background: multi-frequency observations offer significant advantages!
Multifrequency observations turn this …. Power Angular scale Effects of 2’ beam Schulz & White (2003)
Cluster finding 101 • The optimal way to find and characterize sources in the next generation of SZ experiments is an open question. • This is much easier with 2 frequencies than 1! • Source confusion is likely. • Proposed experiments are tremendously powerful and will return huge numbers of cluster candidates. • How do we select a subset for follow up? • How do we estimate mass and redshift? • Diego, Mohr, Silk & Bryan (2003)
Finding clusters of galaxies using … galaxies! … with Chris Kochanek
Matched filter algorithm • New implementation of the matched filter algorithm of Postman et al. (1996) • Several technical improvements over existing methods. • Combines matched filter with “CLEAN” to build a global likelihood. • Can understand results “analytically”. • Tested on simulations, applied to 2MASS data – an iterative sequence.
Mock galaxy surveys Use a strategy borrowed from semi-analytic galaxy formation, but don’t follow mergers so can keep full N-body resolution. • Start with a high resolution N-body simulation in which we can identify the halos which will host the galaxies of interest. [Actually harder than it sounds …] • Each halo gets an integer number of galaxies, drawn from a distribution N(M). • Poisson at high mass. • Sub-poisson at low mass. • First galaxy lies at halo center. Satellites trace the mass. • Luminosities follow Φ(L|M) • Typical luminosity decreases at low M. • Faint-end slope decreases at low M.
Suitable for testing algorithms • By construction, the luminosity function and number counts match observations. • Colors can be added in a number of ways. • It is relatively easy to adjust N(M) to get the right clustering (2-point function). • Clusters and redshift space distortions look “okay”. • All the ‘galaxy formation’ physics is put in by hand to match observations - little predictive power!
Results from 2MASS … • Test with galaxies in the 2MASS catalog. • Galaxies selected in K band • K<12.25 (extinction corrected) • |b|>5o • 91,670 galaxies over 91% sky. • Redshifts 86% complete for K<11.25 and 35% complete for K<12.25. • Deeper photometric catalogue really helps in finding clusters.
2MASS clusters • Find ~700 cluster candidates. • Redshifts and dispersions agree with literature. [Can use prob. weighting.] • Scaling relations well measured. • Can use counting to estimate N(M): • N(M)~M [2MASS galaxies trace mass?!] • Scatter consistent with Poisson.
Conclusions • Optical, SZ and lensing all “work” for finding clusters but all suffer from projection effects. • Photo-z or “true”-z information can mitigate this for optical surveys. • Future SZ surveys have awesome power to find large numbers of clusters to very high redshift. • Any scatter in the M-observable relation leads to low “efficiency” for constructing complete, mass limited samples. • Is a mass limited sample the right goal?
Weak lensing maps: simulations 50 Raw convergence map – roughly projected mass. + noise from shear reconstruction Filtered White, van Waerbeke & Mackey (2002)
Another view … MW&L
Lensing: Completeness & Efficiency White, van Waerbeke & Mackey (2002)
Lensing scatterplots M>1014Msun Large scatter means low completeness At fixed mass the threshold is distance dependent!
SZ Observations In contrast to X-ray emission, SZ surface brightness is independent of cluster redshift, clusters can be seen at any distance!
ALMA pathfinder experiment (APEX) MPIfR/ESO/Onsala/Berkeley • Telescope Specifications: • 12 m on-axis ALMA prototype. • 45’’ at 150 GHz/ 30’ field of view. • Use in drift scanning mode. • Located at 16,500 ft in the Andes. • Telescope and receiver fully funded. • Receiver Specifications: • 300 element bolometer array • 300 mK s ½ • 1 pixel @ 10mK in 3 sec!! On line, late 2004 25% of telescope time will be dedicated to SZ survey
Results from simulations … • Works with mix of photo- and spectro- data. • Deeper photo catalog helps cluster hunting! • Efficient and reliable method for finding clusters, even with “crude” redshifts. • Get membership probability for each galaxy • Allows estimate of <z> or s. • Robustly finds clusters to well past survey median, usually out to 90th percentile. • The most common failure modes easily eliminated by follow-up.