Download
1 / 19
190 likes | 194 Views
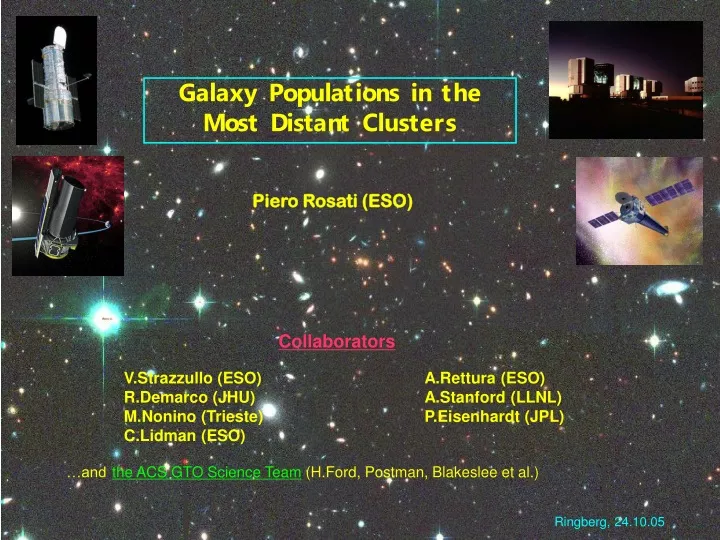
V.Strazzullo (ESO) R.Demarco (JHU) M.Nonino (Trieste) C.Lidman (ESO). A.Rettura (ESO) A.Stanford (LLNL) P.Eisenhardt (JPL). Galaxy Populations in the Most Distant Clusters. Piero Rosati (ESO). Collaborators. …and the ACS GTO Science Team (H.Ford, Postman, Blakeslee et al.).

E N D
V.Strazzullo (ESO) R.Demarco (JHU) M.Nonino (Trieste)C.Lidman(ESO) A.Rettura (ESO) A.Stanford (LLNL) P.Eisenhardt (JPL) Galaxy Populations in the Most Distant Clusters Piero Rosati (ESO) Collaborators …andthe ACS GTO Science Team (H.Ford, Postman, Blakeslee et al.) Ringberg, 24.10.05
Motivation & Plan • Studies of clusters at z>1 provide the strongest constraints on formation scenario of cluster galaxy populations • Multiwavelength data sets - HST/ACS, VLT/ISAAC, Spitzer/IRAC - are needed to sample optical and near-IR restframe properties • part of the “ACS intermediate-redshift cluster program” • Measuring differences in properties between field and cluster galaxies provide a critical test for hierarchical formation models (easier at z>1!)(zF for gals of a given mass should depend on environment) • Tools: • Color-magnitude diagrams with HST/ACS and VLT/ISAAC • Stellar masses and ages from SED fitting of 9 passband photometry + composite spectra
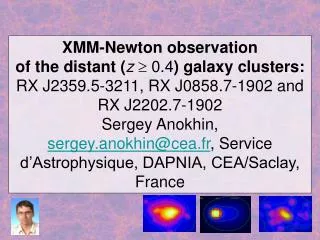
RDCS1252.9-2927 at z=1.237 Mosaic of 4 ACS pointings, total of 20 orbits in z band, 12 orbits in i band combined with deep ISAAC imaging38 spec members from VLT/FORS2 FORS B + ACS z + ISAAC Ks
BzK 5” Some cluster members in RDCS1252-29 with HST/ACS Early-type spectra Late-type spectra AGN-2
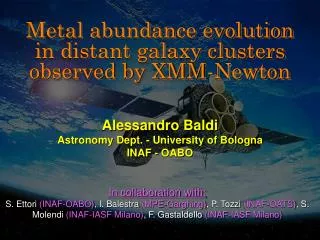
VLT/ISAAC Lidman et al. 2004 Coma at z=1.24 Kodama&Arimoto 97 models ZF= 2,3,5 E S0 Late RDCS1252 (z = 1.24) C-M Relation with HST/ACS and VLT/ISAAC(Blakeslee et al. 03; Lidman et al. 03; Rosati et al . 04) HST/ACS The scatter and slope of the red sequence is very similar to low-z clusters, basically frozen over 65% of look-back times !
RDCS0910 (z=1.10) - HST/ACS I & z bands + Chandra overlay
S0 RDCS0910 (z = 1.105) C-M Relation with HST/ACS(Mei et al. 2005a) RDCS1252 S0 red.seq
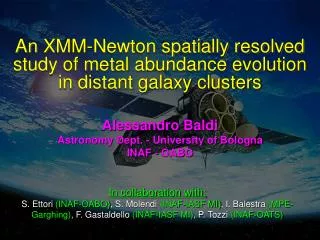
C-M Relation of Lynx clusters (z = 1.27)(Mei et al. 2005b) Lynx E (z=1.26) Lynx W (z=1.27)
Lynx (z = 1.26, 1.27) C-M Relation with HST/ACS(Mei et al. 2005b) Coma
(no) Evolution of the CMD slope and scatter out to z=1.3 Bower et al. 92 Ellis et al. 97 Stanford et al. 97 Van Dokkum et al. 01 Blakeslee et al. 03 Mei et al. 05a, b (Mei et al. 05b)
Log(Mphot) Log(Mdyn) Measuring stellar massesComparing Dynamical & Photometric Masses at high redshift • Dynamical masses for 51 galaxies at z=0.7-1.3 are available in GOODS/CDFS and RDCS1252 fields (van der Wel+ 05, di Serego Alighieri+ 05) • Excellent multi-wavelength coverage in both fields (9 bands from B through 3.6) allows accurate SED fitting up to K rest-frame:VLT/FORS HST/ACS VLT/ISAAC Spitzer/IRAC • Compare dynamical and stellar masses at z~1, with the bonus of morphological information • Stellar Pop models: BC03, Pegase Rettura et al. (2005)
Stacked spectrum of field galaxies (K20) at similar redshifts does not show prominent Hdabs line > Significant Hdabs line • Last SF @ z=1.4-1.8 • Complex SF history needed to fit both SED and Spectrum Composite spectrum of 10 brightest members at <z> = 1.237(Rosati, Demarco 03) Local Ell K20 Ell stack z~1 Cluster Ell stack z=1.24
XMMJ 2235-25 at z=1.4 (Mullis et al. 2005) Most distant X-ray luminous cluster known to date ~0.5 Gyr beyond Lynx clusters (z=1.27) ~1 Gyr beyond RDCS0910 (z=1.1)
Cluster red-sequence at z=1.4 from ISAAC observations (Kodama&Arimoto 97models) • Again: stellar populations appear ~3 Gyr old, i.e. zF~-4 (progenitor bias?) • Is the slope getting flat ?? (must wait for careful HST analysis…)
Evolution of distant ACS clusters in i-z vs J-Ks and comparison with CSP (KA97) tracks z=1.10 1.24 1.27 z=1.4 RXJ0152 MS1054 z=0.83 At z>1 the CMD does not appear to be universal, clusters might take different evolutionary tracks..
Conclusions • Clusters and their galaxy populations were already in an advanced evolutionary state by z=1.4 (passive evol over 9 Gyrs) - considered heretic only 7 yrs ago… • Analyses of colors of massive cluster galaxies at increasing redshifts (at z>1) indicate that formation histories might be different (as expected but it’s nice to see it).. • Mass distributions in a range of environmental densities are similar at z~1 (exception of cluster cores) (see Strazzullo’s talk) • No apparent color-sequence in proto-clusters at z>2 (Miley et al.), are 2 Gyrs (~2 cluster crossing times) enough to build up a tight color sequence by z=1.3-1.4 ?- We have a good chance of observing the onset of the morphology-density relation at z<~2 in the near future