Download
1 / 12
120 likes | 197 Views
Latitudinal Trend of Roughness and Circumpolar Mantles on Mars. M. A. Kreslavsky J. W. Head III Brown University. Statistical characterization of kilometer-scale topography with MGS MOLA data. MOLA - measurements of the surface elevation: ~ 600 000 000 shots

E N D
Latitudinal Trend of Roughnessand Circumpolar Mantles on Mars M. A. Kreslavsky J. W. Head III Brown University
Statistical characterization of kilometer-scale topography with MGS MOLA data • MOLA - measurements of the surface elevation: • ~ 600 000 000 shots • 0.3 km shot-to-shot distance along track • up to 1.5 km gaps between tracks • up to 0.3 m vertical precision • up to 3 m vertical accuracy M. A. Kreslavsky, J. W. Head (2000) JGR-Planets, v. 105, no. E11, p. 26,695 - 26,711 + some new results
d characterizes profile curvatureat given pointat given baseline. We calculated d for each shotand binned into map cells Map grid: 8x8 cells per degree. Typically ~40-80 shots per map cell Baselines used: 0.6 km2.4 km9.6 km
Curvature-frequency distribution:a statistical characteristic of topographic pattern For each map cellwe calculated interquartile widthof the distribution. It characterizesroughness at given baselinefor given map cell. All map cells form a roughness mapfor each baseline We combined 3 maps for 3 baselines into one color map Baselines used: 0.6 km2.4 km9.6 km
Roughness map Blue 0.6 km baseline Green 2.4 km baseline Red 9.6 km baseline Brighter = Rougher
Roughness map • Olympus Mons Aureole: very rough • Amazonis and Elysium Planitia: very smooth • Dune fields: rough at small scale, flat in large scale • Polar caps: smooth at small scale; steep larger-scale slopes • Volcanic plainsare smootherthan highlands • Northern lowlands are rather smooth and have characteristic 3-km-scale roughness
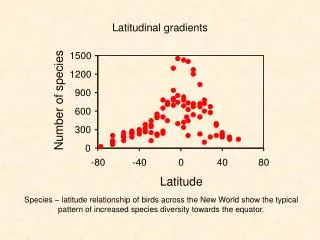
Latitudinal trend of roughness S hemisphere: highlands at low latitudes are rougher (30N - 30S) highlands at high latitude are smoother (>60S) at 0.6 km baseline N hemisphere: Similar trend partly masked with the dichotomy boundary and other intrinsic roughness contrasts. Interpretationthat survived tests with high-resolution MGS MOC images:Manifestation of unique type of surface mantle depositswith specific meter-scale texture
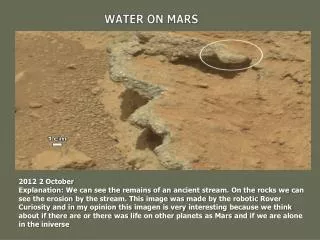
MGS MOC image M03/04333 The deposits with specific fine texture (center)are superposed over underlying topography at 47N in Utopia Planitia 500 m
MGS MOC image M23/01695 Dark dunes travel over the deposits with specific texture at ~75N and leave no traces. The deposits are strong, probably cemented 500 m
MGS MOC image M02/01316 The deposits with specific texture show complex stratigraphy.The uppermost layer 4 m thick is removed in some places. Circular features are impact craters of cratered cones, degraded and mantled. 500 m
High-latitude surface mantle deposits: • Very likely cemented by water ice • May be desiccated at lower latitudes (30-60) (Mustard et al., 2001) • Currently undergoing slow degradation at margins (?) (Mustard et al., 2001) • > 1-3 m thick ( <= roughness signature) • ~3 m thick at margins ( <= MOC images, Mustard et al., 2001)
High-latitude surface mantle deposits: • Diverse morphology • Complex stratigraphy • History of successive deposition and removal • Persisted through at least Late Amazonian • Undergo changes during obliquity cycles • A range of processes operating ( <= MOC high-resolution images)