Download
1 / 33
330 likes | 437 Views
Decadal mean annual recharge estimates in the Sand Hills. Jozsef Szilagyi r esearch hydrologist School of Natural Resources, UNL. The water balance of the unsaturated-zone control volume: P – SR - SSR = ET ± Δ SM + nR.

E N D
Decadal mean annual recharge estimates in the Sand Hills Jozsef Szilagyi research hydrologist School of Natural Resources, UNL
The water balance of the unsaturated-zone control volume: P – SR - SSR = ET ± ΔSM + nR If no significant trend is observed in gw-table levels over a longer period: (1/N)Σ(P – SR – SSR) = (1/N)ΣET ± 0 + (1/N)ΣnR P – SR - SSR = ET + nR In the Sand Hills SR and SSR are typically negligible, thus: nR ≈ P - ET
Why recharge matters? -- Current and future well-being of agriculture in Nebraska depends on the wide availability of groundwater for irrigation -- Groundwater that eventually ends up in the air (purposefully via irrigation) must be balanced by recharge for long-term sustainability, so recharge is the ultimate control variable in the system -- Any regional groundwater quantity modeling needs recharge rates -- Any groundwater quality modeling also needs recharge rates
ET cools the surface very effectively → land surface temperature (Ts) must be related to ET rate From observations (included in SEBAL, METRIC models): near surface air temperature gradient (dzTa) is directly proportional to Ts If there is a suitable spatial scale over which surface properties do not change significantly → net energy at the surface and aerodynamic resistance(ra) are near constant → sensible heat flux (dzTa / ra ) is directly proportional to Ts → ET is directly proportional to Ts Background on CREMAP
The 1km spatial scale of MODIS Ts data (from 2000 on) is ideal: surface albedo typically changes minimally among the cells for NE (17±1.2%)→ net energy at the surface can be near constant for flat or rolling terrain is large enough to have various cover types within most of the cells → ra may become near constant for time periods of days or longer (under neutral conditions ra relates to the logarithm of the roughness height)Slide 4 is small enough to give good resolution at the watershed scale The MODIS scale
Definiton of two anchor points for the linear transformation: -- Mean Ts (<Ts>) of a region plus mean ET (E) from the Complementary Relationship (CR) of evaporation by WREVAP (1985) of Morton -- Ts (<Tsw>) of the coldest surface area which cools itself at the maximum rate of ET (Ew) which derives from the Priestley-Taylor (1972) equation since the 1km scale is the effective lower scale for P-T (Brutsaert, 1982) Transformation of Ts into ET
The Ts – ET transformation is done on a monthly basis for altogether 8 regions in Nebraska The monthly time-step eliminates cloud contamination of the MODIS pixels It is the typical time-step of hydrologic models Input data: Ts (MODIS), Ta, Td, Rs (from PRISM & GEWEX) Application of the transformation equation
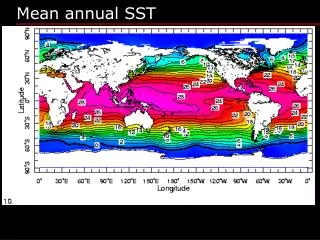
Mean annual ET (mm), 2000-2009 (39) (31.5) (23.5) (16)
Mean annual ET / P, 2000-2009 Check out the eastern outlines of the Sand Hills!
(8) (6) (4) (2)
Verification of CREMAP results:-- two riparian forest locations (near Gothenburg and Odessa) -- three Sand Hills locations at the Gudmundsen Ranch-- one agricultural location near Mead
Three sites: (1) wet meadow; (2) dry meadow; (3) dunal upland
(20) (18.5)
(27.6) (25.2) (26) (24.5)
The Mead site
ETest = 608 mm/yr (24) ETmeas = 642 mm/yr (25.2)
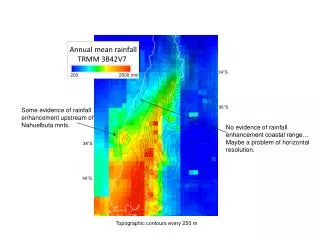
Mean annual (2000-2009) precipitation in the Sand Hills Mean: 533 mm/yr (21) (15.7) (19.7) (23.6) (27.5)
Mean annual (2000-2009) ET in the Sand Hills The CREMAP ET rates are adjusted for the 7.6% overestimation Calamus Niobrara Snake Mean: 460 mm/yr (18) Goose Cr. N. Loup M. Loup Dismal Birdwood Cr. (15.7) (19.7) (23.6) (27.5) (31.5) mm/yr
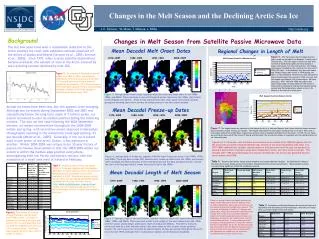
Mean annual (2000-2009) net recharge in the Sand Hills Mean: 73ε±50 mm/yr (2.87ε±1.97) The error-bounds come from an assumed 5% error in P, ET (4) (8) (12) Discharge Recharge
Mean annual (2000-2009) net recharge to precipitation ratio (1 – ET/P) in the Sand Hills Mean: 14ε±9 % Discharge Recharge
The effect of irrigation to recharge rates: No induced net recharge effect for center pivots: it is the opposite Center pivots in the Sand Hills While center pivots mean only reduced recharge rates in the eastern part of SH, their boosted ET surpass precipitation rates in the western part (net recharge is negative)
Effect of afforestation (Ponderosa pine) on ET National Forest near Halsey, NE
Verification of the method within the Sand Hills: -- Clover (1972), Chen & Chen (2004) report a recharge to P ratio of 13% for the Middle-Loup and Dismal Rivers, together -- From USGS discharge records it becomes 16% and 11%, resp. -- The current method gives: 9ε±9% and 12ε±9% -- From USGS discharge records we have 13% for the North-Loup -- The current method gives: 14ε±9% The average recharge rate for the 3 adjacent watersheds is 13% from discharge values compared with our 12ε±9%, or 65ε±45 mm/yr (2.56ε±1.77)
References:Brutsaert, W., 1982. Evaporation into the Atmosphere, D. Reidel, Dordrecht, the Netherlands.Chen, X., Chen, X., 2004. Simulating the effects of reduced precipitation on groundwater and streamflow in the Nebraska Sand Hills, J. Water. Res. Assoc., 40(2), 419-430.Clover, R. E., 1972. Deep percolation in a Sand Hills area, J. Water. Res. Assoc., 8(2), 399-400.Morton, F., Ricard, F., Fogarasi, F., 1985. Operational estimates of areal evapotranspiration and lake evaporation – program WREVAP. National Hydrological Research Institute Paper #24, Ottawa, Ontario, Canada.Priestley, C., Taylor, R., 1972. On the assessment of surface heat flux and evaporation using large-scale parameters, Monthly Weather Rev. 100, 81-92.Szilagyi, J.,Kovacs, A., 2010. A calibration-free evapotranspiration mapping (CREMAP) technique for spatially-distributed regional-scale hydrologic modeling, J. Hydrol. Hydromech., in press.Szilagyi, J., Kovacs, A., 2010. Complementary-relationship-based evapotranspiration mapping (CREMAP) technique for Hungary, Periodica Polytechnica, 54(2), 95-100.Special thanks to Dave Billesbach, Shashi Verma, Andy Suyker, Suat Irmak from UNL, and the USGS office in Lincoln for sharing their ET data!