Download
1 / 29
290 likes | 557 Views
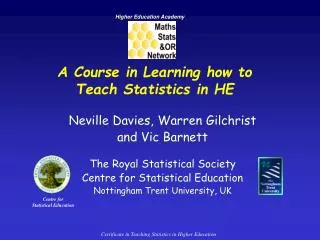
A 2 nd Course in Statistics . Dr. Shonda Kuiper Grinnell College www.pearsonhighered.com/kuiper1einfo/ kuipers@grinnell.edu. Outline. Need for a Second Course in Statistics Benefits of an Activities-Based Approach Description of Course Materials Course Syllabus Student Impact.

E N D
A 2nd Course in Statistics Dr. ShondaKuiper Grinnell College www.pearsonhighered.com/kuiper1einfo/ kuipers@grinnell.edu
Outline • Need for a Second Course in Statistics • Benefits of an Activities-Based Approach • Description of Course Materials • Course Syllabus • Student Impact
Need for a Second Course in Statistics • Growing interest in the AP statistics course. • 7600 in 1997 to over 116,000 in 2009 take the exam • Over 68,000 scored a 3 or higher in 2009 Data Collected from AP Central http://professionals.collegeboard.com/data-reports-research/ap
Need for a Second Course in Statistics • Growing interest in the AP statistics course. • Growing enrollments if the undergraduate level introductory statistics course. • introductory statistics enrollments more than doubled (130,000 to 278,000) from 1990 to 2005 – compared to a 12% drop in first-semester calculus enrollments (433,000 to 381,000) over the same period. David Lutzer, Stephen Rodi, Ellen Kirkman, and James Maxwell. (2007) Statistical Abstract of Undergraduate Programs in the Mathematical Sciences in the United States: Fall 2005 CBMS Survey. American Mathematical Society.
Need for a Second Course in Statistics • Growing interest in the AP statistics course. • Growing enrollments if the college level introductory statistics course. • Growing needs of client disciplines. • Quantitative analysis, modeling, and prediction play increasingly significant day-to-day roles in today’s biomedical research. To prepare for this sea change in activities, biology majors headed for research careers need to be educated in a more quantitative manner, and (all biology majors)… should be adept at using computers to acquire and process data, carry out statistical characterization of the data and perform statistical tests, and graphically display data in a variety of representations. BIO2010: Transforming Undergraduate Education for Future Research Biologists. (2003), “A New Biology Curriculum.” National Academies Press, Chapter 2, pp. 47-48. http://www.nap.edu/books/0309085357/html/47.html
Need for a Second Course in Statistics • Growing interest in the AP statistics course. • Growing enrollments if the college level introductory statistics course. • Growing needs of client disciplines. • National advisory projects. • GAISE Guidelines (www.amstat.org/education/gaise/ ) • The Undergraduate Statistics Education Initiative (USEI) encourages math programs to “explore ways to expand and improve undergraduate statistics education” with proposals and recommendations for programs beyond the teaching of introductory statistics, (www.amstat.org/education/index.cfm?fuseaction=usei) • “every mathematical science major should study statistics or probability with an emphasis on data analysis” 2004 CUPM Guide (www.maa.org/cupm/cupm2004.pdf; page 48).
Need for a Second Course in Statistics • Growing interest in the AP statistics course. • Growing enrollments if the college level introductory statistics course. • Growing needs of client disciplines. • National advisory projects. • The CRAFTY workshop on Statistics stated: (1) Data analysis plays a crucial role in many aspects of academic, professional, and personal life. (2) The job market for mathematics majors is largely in fields that use data. (3) Future teachers will need knowledge of statistics and data analysis to be current with the new NCTM Standards and with the new and highly popular AP Statistics course. (4) The study of statistics provides an opportunity for students to gain frequent experience with the interplay between abstraction and context that we regard as critical for all mathematical sciences students. Moore, T., Peck, R., and Rossman, A. (2000), “Calculus Reform and the First Two Years (CRAFTY).” www.maa.org/cupm/crafty/cf_project.html
Benefits • Broaden student understanding of the intellectual content and applicability of statistics as a discipline • Get students excited about statistics • Student groups work with real datasets from multiple disciplines • Bridge the gap from smaller, focused textbook problems to large projects
Benefits • Active learning lowers the threat of failure. • “…graduate students in statistics often are reticent to the point of inaction. Somehow, in emphasizing the logic of data manipulation, teachers of statistics are instilling excessive cautiousness. Students seem to develop extreme risk aversion, apparently fearing that the inevitable flaws in their analysis will be discovered and pounced upon by statistically trained colleagues. Along with communicating great ideas and fostering valuable introspective care, our discipline has managed to create a culture that often is detrimental to the very efforts it aims to advance.” Brown, E., and Kass. R., (2009), “What is Statistics”, The American Statistician. May 1, 2009, 63(2): 105-110
Benefits • Active learning lowers the threat of failure. • Tasks are sequenced to allow early success and maintaining a threshold at which students feel challenged but not overwhelmed. • Students can feel free to experiment. They are challenged to try new strategies and modify their strategy until they are successful. • The level of complexity of the projects are adaptable for each student or group.
Benefits • Context fosters a sense of engagement and encourages students to go deeper than the assignment requires • Clear links between learning and goals: real data provides an intrinsic motivation to ask more questions • Provides early steps to a new domain; students often choose to read additional literature from other disciplines • Emphasizes the full statistical process in a study • Connections between statistical techniques and context reinforces conceptual understanding rather than mere rote knowledge of procedures.
Benefits • Students are engaged by seeing the results of their unique research question. • A classroom environment where groups of students are conducting unique (but related) research projects creates an atmosphere where students are eager to share their work. • Students want to compare their results and discuss how slight modifications in their data collection or model assumptions can impact the results. • Students share tips, experiences, and knowledge which can be similar to peer-to-peer teaching.
Benefits • Students who take only an intro course are no longer equipped to apply the more relevant statistical methods in their own work • “We may be living in the early twenty-first century, but our curriculum is still preparing students for applied work typical of the first half of the twentieth century.” • “Before computers statisticians had no choice. These days we have no excuse. Technology allows us to do more with less: more ideas, less technique. We need to recognize that the computer revolution in statistics education is far from over.” Cobb, G. (2007) “The Introductory Statistics Course: A Ptolemaic Curriculum?”,Technology Innovations in Statistics Education: Vol. 1: No. 1,
Benefits • Students who take only an intro course are no longer equipped to apply the more relevant statistical methods in their own work • “Statistics has moved somewhat away from mathematics back toward its roots in scientific inference and the analysis of data.” • Suzanne Switzer and Nick Horton. (2007) “What Your Doctor Should Know about Statistics (but Perhaps Doesn't).” Chance. 20(1): 17-21. Cobb, G. (1992), “Teaching Statistics”, in L.A. Steen (ed.) Heeding the Call for Change: Suggestions for Curricular Action, Mathematical Association of America,
Benefits • Students who take only an intro course are no longer equipped to apply the more relevant statistical methods in their own work • “Curricula in statistics have been based on a now outdated notion of an educated statistician as someone knowledgeable about existing approaches to handling nearly every kind of data…The net result is that at every level of study, gaining statistical expertise has required extensive coursework, much of which appears to be extraneous to the compelling scientific problems students are interested in solving.” Brown, E., and Kass. R., (2009), “What is Statistics”, The American Statistician. May 1, 2009, 63(2): 105-110.
Description of Course Material • Chapter: Guided activities step students through a case-based introduction to each statistical topic • Focus on conceptual understanding - only AP stats background is required • Emphasizes models and check assumptions • Extended Activities provide optional mathematical details and more advanced ideas • Project uses current research to motivate students to apply statistical techniques to a new context
Example Chapter: How Much is Your Car Worth? • Build a multiple regression model for the retail price of 2005 General Motors (GM) cars • Does not require specialized knowledge • Students work through the entire process of model building and assessment • residual plots • transforming data • variable selection • checking model assumptions • impact of outliers (Cadillac convertibles) • correlated explanatory variables
Cars: Variable Descriptions • Price: suggested retail price of the used 2005 GM car in excellent condition. All cars were less than one year old when priced. • Mileage: number of miles the car has been driven • Make: Buick, Saturn, SAAB, Pontiac, Cadillac, or Chevrolet • Model: models for each car manufacturer such as Ion, Vibe, Cavalier • Trim (of car): specific type of car such as SE Sedan 4Door, Quad Coupe 2Door • Type: body type such as sedan, coupe, etc. • Cylinder: number of cylinders in the engine (4, 6 or 8) • Liter: a more specific measure of engine size • Doors: number of doors (2 or 4) • Cruise: indicates if the car has cruise control (1 = cruise) • Sound: indicates if the car has upgraded speakers (1 = upgraded) • Leather: indicates if the car has leather seats (1 = leather)
Cars: Simple Linear Regression • Are cars with lower mileage worth more? • Price = 24723 – 0.17 Mileage • slope coefficient (b1): t = -4.09 (p-value < 0.001) • R-Sq: 2.0% • Review Questions: • What happens to Price as Mileage increases? • Since b1 = -0.17 is small can we conclude it is unimportant? • Does mileage help you predict price? What does the p-value tell you? • Does mileage help you predict price? What does the R-Sq value tell you? • Are there outliers or influential observations
Cars: Model Checking • Heteroskedasticity (non-constant variance) • Residuals versus order (incorporating dummy variables)
Cars: How Much is Your Car Worth? • The initial model is very poor R-Sq = 2%, but after • a closer look at the residuals, • a transformation, and • appropriate variable selection, • students are able to develop a very strong multiple regression model. • In addition, students learn that there isn’t always just one “best” model when conducting data analysis
Example: Extended Activities • Testing if coefficients are significant. • Interaction and terms for curvature • Mathematical details for variable selection criteria • Model validation
Example Project: What Stimulates Economic Growth? • Read and evaluate primary literature • Guided questions (consistent statistical thinking) • New context from the introductory activities • The Elusive Quest for Growth: William Easterly shows that many attempted "solutions" to economic development problems in poor countries violate basic principles of economics • Objective of the study • Response and explanatory variable(s) • Variables that were held constant during the experiment • How could you modify this experiment if you were going to test the same hypotheses?
Example Project: What Stimulates Economic Growth? • Student groups perform initial analysis on a relatively small 2002 dataset collected from web.worldbank.org population control and economic growth in third-world countries • Conduct and analyze their own study • Build upon current research to develop their own research hypothesis (provides motivation) • Transition from a research question to a statistical model • Collect their own data, conduct their own study, and determine appropriate analysis • Communicate with oral or written reports with peer review
Course Syllabus • Class met 3 times a week for 14 weeks • In computer lab (about one time a week) • All students had at least one introductory statistics course • Freshmen through seniors • Mathematics, Econ, General Science, Biology, Psychology, Philosophy, and Political Science majors
1- 4: C1: Randomization and Permutation Tests (Schistosomiasis) C2: Making Connections: The 2-sample t-test, Regression and ANOVA (What Impacts Memory) Project: Three Page Memo to University President (Gender Discrimination in Faculty Salaries) 5 -7: C3: Multiple Regression (Estimating Car Prices) Project: Research Paper (Economic Growth in 3rd World Countries} 8-10: C6: Categorical (Space Shuttle Challenger ) C7: Logistic Regression (Detecting Cancer through Fine Needle Aspiration) Project: Poster Presentation (Infant Handling among Yellow Baboons or Communication Patterns in Electric Fish) 11-12: C10: Principal Component Analysis (Stock Market Values) Project: Executive Summary (The Hockey Stick Controversy) 13-15: Final Projects (Posters) Course Syllabus Week
C4 Designing Factorial Experiments: Popcorn Project: Seed Germination (Ecology) C5 Block, Split-Plot and Repeated Measure Designs: Memory Project: The Perfection Game (Psychology) C8 An Introduction to Poisson Regression: Detecting Cancer Clusters Project: Superfund Sites and Leukemia (Biostatistics) C9 An Introduction to Survival Analysis: Chocolate Chips Project(s): Lung Cancer (Biology) or Perfection (Psychology) C11 An Introduction to Bayesian Data Analysis: What Colors Come in Your M&M's Candy Bag? Project: Adaptive Stopping Rules for Clinical Trials (Medical Ethics) Other Chapters
Student Feedback • I never thought that I could actually understand scientific papers outside my majors, but I was proven to be wrong. With the same simple procedure, I was able to identify the objective, variables, and several other main points of the labs. It is an amazing class! • I feel like I learned a substantial amount about statistics, and feel very prepared to do data analysis in any internships I may have in the future. • The use of labs for almost every topic was a lot of fun and insightful into the way statistical data can be modeled. I came in not too clear on Statistical techniques even after taking 335 and 336 but this class put a lot into perspective for me. I have thoroughly enjoyed this class and will recommend it to anyone. Even people who don't like stats initially might enjoy the labs, exercises and poster projects. More practical classes like this should definitely be taught
PRACTICING StatisticsA 2nd Course in Statistics CLASS TESTERS NEEDED! www.pearsonhighered.com/kuiper1einfo/ kuipers@grinnell.edu NSF DUE#0510392: ShondaKuiper, Tom Moore, and Linda Collins Thanks to Jeff Sklar, Julie Legler, Sam Rebelsky, Henry Walker and the CAUSE Post-Intro Cluster Group (particularly Nathan Tintle and Doug Andrews)