Download
1 / 20
200 likes | 304 Views
Warm-up. ENTER THE FUNCTION IN THE Y= MENU OF YOUR GRAPHING CALCULATOR.

E N D
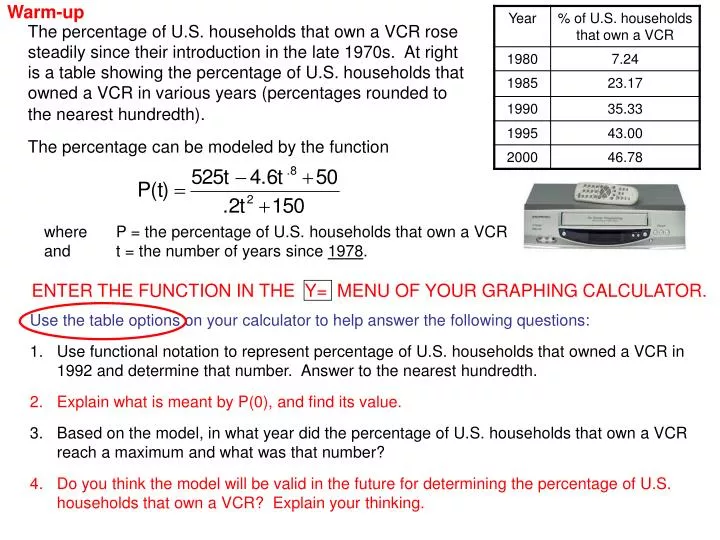
Warm-up ENTER THE FUNCTION IN THE Y= MENU OF YOUR GRAPHING CALCULATOR. The percentage of U.S. households that own a VCR rose steadily since their introduction in the late 1970s. At right is a table showing the percentage of U.S. households that owned a VCR in various years (percentages rounded to the nearest hundredth). The percentage can be modeled by the function where P = the percentage of U.S. households that own a VCR and t = the number of years since 1978. Use the table options on your calculator to help answer the following questions: • Use functional notation to represent percentage of U.S. households that owned a VCR in 1992 and determine that number. Answer to the nearest hundredth. • Explain what is meant by P(0), and find its value. • Based on the model, in what year did the percentage of U.S. households that own a VCR reach a maximum and what was that number? • Do you think the model will be valid in the future for determining the percentage of U.S. households that own a VCR? Explain your thinking.
Warm-up ENTER THE FUNCTION IN THE Y= MENU OF YOUR GRAPHING CALCULATOR. where P = the percentage of U.S. households that own a VCR and t = the number of years since 1978. Use the table options on your calculator to help answer the following questions: • Use functional notation to represent percentage of U.S. households that owned a VCR in 1992 and determine that number. Answer to the nearest hundredth. • Explain what is meant by P(0), and find its value. • Based on the model, in what year did the percentage of U.S. households that own a VCR reach a maximum and what was that number? • Do you think the model will be valid in the future for determining the percentage of U.S. households that own a VCR? Explain your thinking.
ENTER THE FUNCTION IN THE Y= MENU OF YOUR GRAPHING CALCULATOR. The percentage of U.S. households that own a VCR rose steadily since their introduction in the late 1970s. At right is a table showing the percentage of U.S. households that owned a VCR in various years (percentages rounded to the nearest hundredth). The percentage can be modeled by the function where P = the percentage of U.S. households that own a VCR and t = the number of years since 1978. Use the table options on your calculator to help answer the following questions: 1. Use functional notation to represent percentage of U.S. households that owned a VCR in 1992 and determine that number. Answer to the nearest hundredth. 2. Explain what is meant by P(0), and find its value. • Based on the model, in what year did the percentage of U.S. households that own a VCR reach a maximum and what was that number? 4. Do you think the model will be valid in the future for determining the percentage of U.S. households that own a VCR? Explain your thinking.
ENTER THE FUNCTION IN THE Y= MENU OF YOUR GRAPHING CALCULATOR. The percentage of U.S. households that own a VCR rose steadily since their introduction in the late 1970s. At right is a table showing the percentage of U.S. households that owned a VCR in various years (percentages rounded to the nearest hundredth). The percentage can be modeled by the function where P = the percentage of U.S. households that own a VCR and t = the number of years since 1978. Use the table options on your calculator to help answer the following questions: 1. Use functional notation to represent percentage of U.S. households that owned a VCR in 1992 and determine that number. Answer to the nearest hundredth. 2. Explain what is meant by P(0), and find its value. • Based on the model, in what year did the percentage of U.S. households that own a VCR reach a maximum and what was that number? 4. Do you think the model will be valid in the future for determining the percentage of U.S. households that own a VCR? Explain your thinking.
ENTER THE FUNCTION IN THE Y= MENU OF YOUR GRAPHING CALCULATOR. The percentage of U.S. households that own a VCR rose steadily since their introduction in the late 1970s. At right is a table showing the percentage of U.S. households that owned a VCR in various years (percentages rounded to the nearest hundredth). The percentage can be modeled by the function where P = the percentage of U.S. households that own a VCR and t = the number of years since 1978. Use the table options on your calculator to help answer the following questions: • Use functional notation to represent percentage of U.S. households that owned a VCR in 1992 and determine that number. Answer to the nearest hundredth. • Explain what is meant by P(0), and find its value. • Based on the model, in what year did the percentage of U.S. households that own a VCR reach a maximum and what was that number? • Do you think the model will be valid in the future for determining the percentage of U.S. households that own a VCR? Explain your thinking. P(14) = 38.91%
ENTER THE FUNCTION IN THE Y= MENU OF YOUR GRAPHING CALCULATOR. The percentage of U.S. households that own a VCR rose steadily since their introduction in the late 1970s. At right is a table showing the percentage of U.S. households that owned a VCR in various years (percentages rounded to the nearest hundredth). The percentage can be modeled by the function where P = the percentage of U.S. households that own a VCR and t = the number of years since 1978. Use the table options on your calculator to help answer the following questions: • Use functional notation to represent percentage of U.S. households that owned a VCR in 1992 and determine that number. Answer to the nearest hundredth. • Explain what is meant by P(0), and find its value. • Based on the model, in what year did the percentage of U.S. households that own a VCR reach a maximum and what was that number? • Do you think the model will be valid in the future for determining the percentage of U.S. households that own a VCR? Explain your thinking. P(14) = 38.91% P(0) is the percentage of U.S. households that owned a VCR in 1978. P(0) = .33%
ENTER THE FUNCTION IN THE Y= MENU OF YOUR GRAPHING CALCULATOR. The percentage of U.S. households that own a VCR rose steadily since their introduction in the late 1970s. At right is a table showing the percentage of U.S. households that owned a VCR in various years (percentages rounded to the nearest hundredth). The percentage can be modeled by the function where P = the percentage of U.S. households that own a VCR and t = the number of years since 1978. Use the table options on your calculator to help answer the following questions: • Use functional notation to represent percentage of U.S. households that owned a VCR in 1992 and determine that number. Answer to the nearest hundredth. • Explain what is meant by P(0), and find its value. • Based on the model, in what year did the percentage of U.S. households that own a VCR reach a maximum and what was that number? • Do you think the model will be valid in the future for determining the percentage of U.S. households that own a VCR? Explain your thinking. P(14) = 38.91% P(0) is the percentage of U.S. households that owned a VCR in 1978. P(0) = .33% The maximum 47.87% was reached in 2005.
Answers to even-numbered HW problems Section 2.1 S-8 S-12 Limiting value appears to be .4 Ex 6 a) P(5) = $4,000 b) c) The maximum profit is $7,200 (for producing 9 items) The 2 break even points are 3 items and 15 items produced.
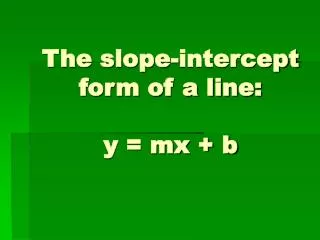
t 0 10 20 30 40 46 54 If t represents the number of years since 1940, the function that models this data is: Average Miles per Gallon (in miles per gallon) by Year of all United States Automobiles
Entering equations Setting the viewing window Viewing graphs Tracing along a graph
1. Make a graph of G versus t, where t is measured in years since 1940. Step 1: Enter the equation. Average Miles per Gallon (in miles per gallon) by Year of all United States Automobiles
1. Make a graph of G versus t, where t is measured in years since 1940. Step 2: Set the window using the data. Average Miles per Gallon (in miles per gallon) by Year of all United States Automobiles
1. Make a graph of G versus t, where t is measured in years since 1940. Step 2: Set the window using the data. Average Miles per Gallon (in miles per gallon) by Year of all United States Automobiles
1. Make a graph of G versus t, where t is measured in years since 1940. Step 2: Set the window using the data. Average Miles per Gallon (in miles per gallon) by Year of all United States Automobiles
1. Make a graph of G versus t, where t is measured in years since 1940. Step 3: View the graph. Average Miles per Gallon (in miles per gallon) by Year of all United States Automobiles
Use the graph to find the averagegas mileage of a U.S. car in 1990. Step 4: Press Trace and scroll to the desired year. Average Miles per Gallon (in miles per gallon) by Year of all United States Automobiles
Use the graph to find the averagegas mileage of a U.S. car in 1990. A better way: On the graph, press Trace and type in the desired year (in this case 50) and press Enter. Average Miles per Gallon (in miles per gallon) by Year of all United States Automobiles
3. How would you use the graph and the trace feature to find the year with the lowest (minimum) gas mileage? Average Miles per Gallon (in miles per gallon) by Year of all United States Automobiles
What if we had the function , where G = average gas mileage of U.S. cars and t = years since 1940 but no data table was given. Suppose we wanted to make a graph of average gas mileage of U.S. cars from 1940 to the present. How could we set an appropriate window for the graph?
Homework: All graphs to be done on calculator only Read section 2.2 Page 144 # S-3, S-9, S-12 Pages 145 – 150 # 1, 4, 7, 17