Download
1 / 31
800 likes | 2.02k Views
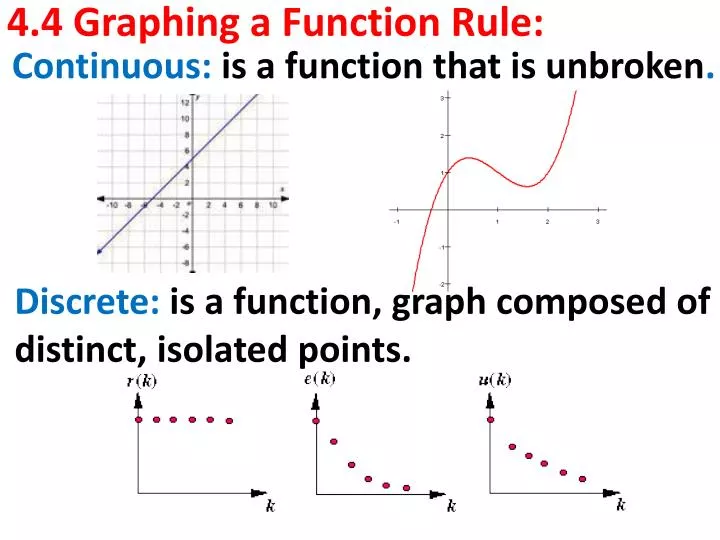
Continuous: is a function that is unbroken . 4.4 Graphing a Function Rule:. Discrete: is a function, graph composed of distinct, isolated points. . GOAL:. Graphing a Function Rule:.

E N D
Continuous: is a function that is unbroken. 4.4 Graphing a Function Rule: Discrete: is a function, graph composed of distinct, isolated points.
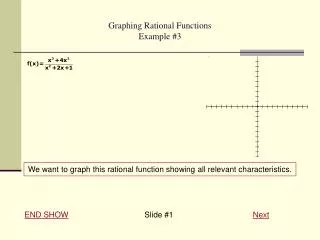
Graphing a Function Rule: Whenever we are given a function rule-(equation) we must always create a table to obtain the ordered pairs (x, y) we must use to create the corresponding graph. Ex: Provide the graph that represents: f(x) = - 2x +1
2. Take the ordered pair column and create the scale for both, x and y axis y axis X axis
3. Plot the ordered pairs. y axis X axis
4. Connect the ordered pairs. y axis X axis
5. Label the graph with the proper function. y axis X axis f(x) = -2x + 1
Real-World Problems: The function rule W= 146c + 30,000 represents the total weight W, in pounds, of a concrete mixer truck that carries c cubic feet of concrete. If the capacity of the truck is about 200 ft3, What is a reasonable graph of the function rule?
Real-World Problems: Create a table:
Graph: Weight (lbs) 60,000 40,000 20,000 150 50 100 200 Concrete (ft3) The graph does produce a line. Continuous Graph.
YOU TRY IT: A local cheese maker is making cheddar cheese to sell at a farmer’s market. The amount of milk used to make the cheese and the price at which he sells the cheese are shown. Write a function for each situation. Graph each function and decide if it is continuous or discrete.
Milk: 1. The weight w of cheese, in ounces, depends on the number of gallons m of milk used.
Cheese: 2. The amount a of money made from selling cheeses depends on the number n of wheels sold.
Cheese: 1.Looking at the data the rule is:w= 16m
Graph: W = 16m 70 60 Weight, W 40 30 20 10 6 2 4 8 10 milk, m Any amount of milk can be used so connect the points: Continuous.
Cheese: 2. Looking at the data the rule is:a = 9m
Graph: a = 9n 35 30 Amount of money, a 25 20 15 10 5 6 2 4 8 10 Wheels sold, n Since we only get that specific amount, we cannot connect the points: Discrete
YOU TRY IT: The amount of water w in a wadding pool, in gallons, depends on the amount of three times the time t, in minutes, the wadding pool has been filling.
Pool: 2. Looking at the data the rule is:w = 3t
Graph: W = 3t 18 15 Water, w 12 9 6 3 6 2 4 8 10 minutes, t Any amount of water can be used so connect the points: Continuous.
YOU TRY IT: The cost C for baseball tickets, in dollars depends on the number n of tickets bought and each ticket is being sold for $16.
Baseball: 2. Looking at the data the rule is:C = 16n
Graph: C= 16n 60 50 Cost, C 40 30 20 10 6 2 4 8 10 tickets, n Only that amount of money can be collected: Discrete.
Graphing a Non-Linear Function Rule: Whenever we are given a function rule-(equation) we must always create a table to obtain the ordered pairs (x, y) we must use to create the corresponding graph. Ex: Provide the graph that represents: f(x) = - x2 + 1
2. Take the ordered pair column and create the scale for both, x and y axis y axis X axis
3. Plot the ordered pairs. y axis X axis
VIDEOS: Functions https://www.khanacademy.org/math/trigonometry/functions_and_graphs/function_introduction/v/what-is-a-function https://www.khanacademy.org/math/trigonometry/functions_and_graphs/function_introduction/v/basic-linear-function
VIDEOS: Functions https://www.khanacademy.org/math/trigonometry/functions_and_graphs/function_introduction/v/functions-as-graphs
CLASS WORK: Pages: 257 – 259 Problems: As many as it takes to master the concept.