Download
1 / 22
230 likes | 430 Views
It is very difficult to measure the small change in volume of the mercury. If the mercury had the shape of a sphere, the change in diameter would be very small. Therefore, signal modification is required.

E N D
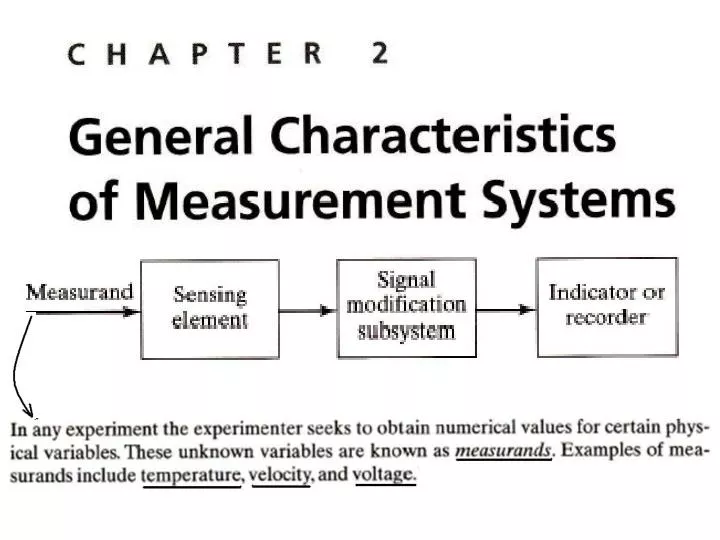
It is very difficult to measure the small change in volume of the mercury. If the mercury had the shape of a sphere, the change in diameter would be very small. Therefore, signal modification is required. For the thermometer, signal modification is accomplished by connecting the bulb to the stem. The inside diameter of the stem is very small relative to the diameter of the bulb, and although the change in mercury volume is small, this small change in volume produces a large change in length of the stem mercury column.
Measurement Error and Related Definitions • Error = measured value - true value • systematic error (fixed-residual-repeatable) • Major source of systematic error: • Calibration of the measurement system is not right- nonlinearity • Loading error • Spatial error • random error (random-precession-not residual- not repeatable ) environmental causes-electrical noise. • Error in this technical usage does not imply that there is any mistake • in the measurement process, although mistakes can cause errors. • What the experimenter can estimate, however, is the uncertainty interval • (or simply uncertainty) of the measurement. • The uncertainty is an estimate (with some level of confidence) of the limits • of error in the measurement. • For example, it might be stated that with 95% confidence, the uncertainty • of a voltage measurement is +/- 1 volt. This means that the error will be • greater than 1 V in less than 5% of the cases. • Narrow uncertainty intervals are usually achieved by using calibrated, high-quality • measuring systems.
Random error = reading - average of readings Systematic error = average of readings - true value
The first major source of systematic error is that resulting from calibration of the measurement system. Systematic errors in the measuring system may be detected and reduced by the process of calibration, discussed later. Some systematic errors caused by using the measuring system in a particular application may be reduced by analytical correction of the data for unwanted effects.
One very important environmental cause of random error is electrical noise. Experiments and measuring systems normally operate in a sea of electric and magnetic fields caused by sources such as building wiring and local radio stations. These electric and magnetic background fields can affect readings by randomly altering voltages in measuring systems and connecting wiring.
The range , Span , accuracy and uncertainty of a measuring system: For example, a voltmeter may have a range of 0 to 10 V and would not give a correct response to measurandsof -5 or 13 V. The span of a measuring system is the difference between the upper and lower values of the range. For example, a voltmeter with a range of (+/-) 3 V has a span of 6 V. accuracy stated as a percent of reading. For example, if the output of a device can range from 0 to 5 V and the accuracy is stated as (+/-) 5% of full scale, the uncertainty is (+/-) 0.25V, regardless of the reading.
Effect of hysteresis on instrument reading. In measuring devices, accuracy is often degraded by a phenomenon known as hysteresis, as shown in Fig. for the same value of the measurand, different output readings may be obtained if the measurand was increasing prior to taking the reading than if the measurand was decreasing. Hysteresis is caused by such effects as friction, mechanical flexure of internal parts, and electrical capacitance. Hysteresis errors, If a measurement is repeated in exactly in thesame manner, errors due to hysteresis would be repeatable and hence would be considered systematic errors.
Sensitivity is determined during the process of calibration, and an error in determining the actual sensitivity results in a systematic error called sensitivity error, An error in sensitivity will affect the span, as shown in Fig. lf the span is not as specified, a span error will result.
Calibration of a Weighing Scale-Static Measurement If a measurand is unchanging in time and if the measurement system instantaneously shows an equilibrium response to the measurand, the measurement process is said to be static A least-squares linear fit result:
Using Fig, we find that it is a simple matter to estimate the accuracy of this weighting device. Two lines are drawn, parallel to the horizontal axis such that all the data are contained between the two lines. For this device, the accuracy limits are +0.45 lb and -0.40 lb. Accuracy is frequently presented as a percent of output span. In this case, the output, as predicted by the curve fit, varies from -0374 to +6.076, giving a span of 6.076 - (-0.374) : 6.45 lb. Accuracy then becomes +7.0% and -6.2 % of the output span. It should be noted that accuracy is a bounding error statement-it includes all residual errors that will occur when the instrument is used with the given linear fit to the data. Accuracy does not include errors due to drift or thermal stability
DYNAMIC MEASUREMENTS If a measurand is unchanging in time and if the measurement system instantaneously shows an equilibrium response to the measurand, the measurement process is said to be static. Ln the general case, however, when the measurand is changing in time and the measuring system does not show instantaneous response, the measurement process is said to be dynamic. For example, the use of an oral thermometer to measure a person's body temperature is a dynamic measurement since the measurement process must be continued for several minutes for the thermometer to come into equilibrium with body temperature. In making dynamic measurements, the experimenter must account for the dynamic characteristics of the measuring system, the dynamic interaction between the measuring system and the test system, and the dynamic characteristics of the test system. When a measurement is dynamic, there is usually an error introduced into the measurement, and the experimenter must take actions to minimize this error.
The dynamic response of a measurement system can usually be placed into one of three categories: zero order, first order, and second order. These categories are based on the order of the differential equation needed to describe the dynamic response. ideal zero-order systems respond instantly to measurandalthough no instrument is truly zero order. However, the dynamic response of many instruments approximate zero-order behavior when measuring slowly changing measurands. Firstordermeasurement systems show capacitance-type energy storage effects. Mechanical analogs to capacitance are springs and devices that store thermal energy. The common thermometer discussed above is an example of a first-order system. Second-order systems have inertial effects of inductance or accelerated mass as well as capacitance energy storage. Common spring-mass systems are second order-the mechanical bathroom scale is an example. Second-order systems include a characteristic called damping, which dissipates energy. Second-order systems with low damping are called Under damped and can show oscillatory response. Highly damped second-order systems are called over damped and will not show oscillatory behavior. The level of damping that divides these two modes of response is called critical damping.
y is the change in the device output, and ye is the equilibrium change in the output of the system, the output that will occur after significant time has passed. Response A is typical of first-order and over damped second- order devices. Response B is typical of under damped second-order systems. First-order systems and over damped second-order systems show an asymptotic response.