Download
1 / 30
300 likes | 421 Views
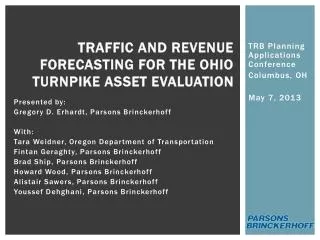
The Ohio DOT Inflation Forecasting and Related Activities. Jennifer McAllister, Ohio DOT presenting for Jeff Hisem. What is BART??. Who does inflation forecasting at Ohio DOT? BART (Bid Analysis & Review Team) Created by Jeff Hisem, Office of Estimating

E N D
The Ohio DOT Inflation Forecasting and Related Activities Jennifer McAllister, Ohio DOT presenting for Jeff Hisem
What is BART?? Who does inflation forecasting at Ohio DOT? BART (Bid Analysis & Review Team) Created by Jeff Hisem, Office of Estimating Multi-person group combines the knowledge and expertise of economics and construction Currently 2 economists Open position for engineer/construction experience
BART’s History with Forecasting In 2005 BART was requested to track and explain historical trends in construction prices. Starting in 2006, BART was requested by the director to create an inflation forecast. In March 2006, BART presented its first forecast Cost Estimation and Inflation Trends Produce forecast January and July each year Annual forecast out five years into future
Predicting OhDOT Construction Cost Inflation Monitor past OhDOT in-place construction cost trends. Research developments for key construction commodities. Model likely scenarios of in-place construction costs
Research Developments for Key Construction Commodities Key Drivers Aggregate Ready Mix Concrete Cement Energy Oil Diesel Liquid asphalt Electricity Natural gas Steel Labor Macro Issues US Construction Demand Exchange rates World demand Regional Factors Ohio construction economy Commodity specific supply/demand
“How might we model scenarios of in-place construction costs?” • Consultant • Pay for a final forecast • Best guess based upon industry publications • A spreadsheet model tracking labor, energy, materials, and equipment costs • Provides a system for a rudimentary forecast • Purely statistical model • Provides a statistically defensible forecast • Methods 3 and 4 allow for in-house scenario testing Simple Complex
Model Likely Scenarios Of In-Place Construction Costs (continued) Key considerations for forecasting group Group with multiple perspectives Unbiased & insulated from politics Group consensus forecast (not an average) Inclusive process that informs key stake holders: Planning Finance } Provide insight about OhDOT’s future spending plans so that these expenditures can be included in the forecast model.
Historical OhDOTForecasts Predicted Cost Inflation CY06-CY10: January 2006 Predicted Cost Inflation FY07-FY11: July 2006 [%] – Actual construction cost inflation (OhDOT Construction Cost Index)
Historical OhDOT Forecasts Predicted Cost Inflation CY07-CY11: January 2007 Predicted Cost Inflation FY08-FY12: July 2007 [%] – Actual construction cost inflation (OhDOT Construction Cost Index)
Historical OhDOT Forecasts Budget Forecast Inflation FY08-FY12: November 2007 Predicted Cost Inflation CY08-CY12: January 2008
Historical OhDOT Forecasts Predicted Cost Inflation FY09-FY13: July 2008
Application of inflation forecast Inflation adjust bid histories for creation of bid history models used in Estimator and CES.
Application of inflation forecast OhDOT administration determines own inflation forecast for program budgeting (after BART construction cost forecast) Budget forecast application Planning future road maintenance costs. Planning estimates for major projects. In Estimator software inflation applied as contingency. Inflation calculated for mid-year of construction “Inflation calculator:” tool available to aid calculation
Review Forecast to Actual Continually improve the methods for forecasting
Energy Diesel Of all our commodities, diesel is the most prone to international influences Liquid Asphalt Pricing is regionally based Few regional refineries OhDOT is a major consumer of asphalt* Shortage of polymer modified asphalt Production interactions between asphalt, diesel, and gasoline affect pricing Speculation trading Exchange Rates
Energy – Liquid Asphalt OhDOT placing index Indicator of state asphalt binder prices
West Texas Intermediate Oil Price: Four Scenarios Scenarios incorporated in July 2008 construction cost forecast.
Steel Iron & Steel Products (WPU101) rose 37% from December 2007 through June 2008.
Steel Input costs and manufacturing costs: Rising energy and transport costs Rising thermal and coking coal prices Increases in iron ore & scrap steel costs in 2008. Weak dollar Reduced imports Increased exports Result: rapidly rising prices in short-term Iron & Steel Products (WPU101) rose 37% from December 2007 through June 2008. Assumption: Short-term price increases that are maintained in the long-term.
U.S. Gross Domestic Product GDP growth acts as a proxy for overall construction demand in the US. GDP ASSUMPTIONS: BART – GDP growth is slow in the short term and improves towards the long term rate of ~ 3% - 4%
Commodities, GDP and the OhDOT Index STAGFLATION: “an inflationary period accompanied by rising unemployment and lack of growth in consumer demand and business activity” For the first time, OhDOT forecasts an economic future in which we must marry rising commodity prices with an overall depressed demand for construction services. OhDOT Index = ƒ(commodity prices, economy’s health)
Competition and Inflation Through many studies, OhDOT has proven that increased competition has a downward effect on prices. Recent declines in vendor competition may be a result of the challenges associated with volatile commodity prices.
Statistical Inflation Forecast Model The model says that most of the movement of the OhDOT Cost Index since 2002 can be estimated by tracking: West Texas Intermediate Oil Prices Steel Mill Prices The Price for Asphalt binder type PG 64-22 U.S. Gross Domestic Product (GDP) OTHER WORK: Review peer works Contact other economic professionals
Vendor Analysis How is vendor behavior affecting competition and thus prices? Who owns whom? Are there sole-source owners? Founded on game theory from the business and economics realms Using this analytical work, BART can provide suggestions for modifying bidding rules to enhance competition as the construction environment changes over time.
Industry Analysis BART provides situational awareness BART understands how events external to the jobsite affect prices.
OhDOT Actual Composite, BART Modeled Index and the Combined Actual and Predicted Inflation Rates