Download
1 / 24
240 likes | 401 Views
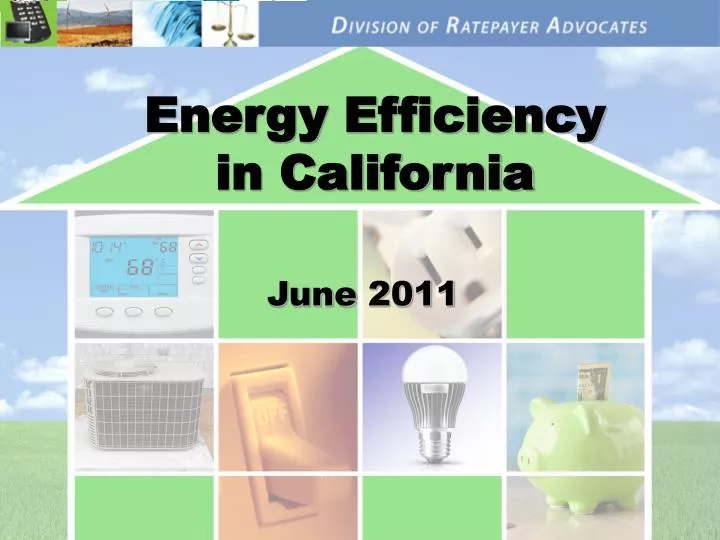
June 2011. Energy Efficiency in California. Overview of Energy Efficiency (EE) in California Top 5 problems with current EE structure 4 ways to address EE problems. Presentation Overview. Minimize need for new generation Reduce peak demand Reduce GHG emissions Improve energy reliability

E N D
June 2011 Energy Efficiency in California
Overview of Energy Efficiency (EE) in California Top 5 problems with current EE structure 4 ways to address EE problems Presentation Overview
Minimize need for new generation Reduce peak demand Reduce GHG emissions Improve energy reliability Improve price stability and lower costs for customers California’s Policy GoalsEnergy Action Plan
1970/80’s: Low-level demand side programs 1980’s: Funded through General Rate Cases (minimal reporting requirements) 1983: EE Manual determines cost-effectiveness 1998: AB 1890 introduces PGC; caps budget at $228 million 2002-04: CPUC orders pursuit of all cost-effective EE; EAP puts EE at top of loading order 2003: CPUC adds PEEBA – procurement dollars as additional funding source; significantly increases EE budget 2006: IOU EE program savings independently verified, for first time 2008: The Energy Action Plan (EAP) EE as top resource to reduce GHG from energy History: Energy Efficiency Policy
Key Policies Impact EE Budget D.03-12-060 PEEBA funds supplement PGC First year EE savings are independently verified ex-post EAP EAP D.02-10-062 Pursue all cost-effective EE EAP
Trends: EE Budget vs. Energy Savings • Peak savings goal increased by 9.2% • Natural gas savings goal increased by ~35% over the same period
Energy Savings vs. Goals Source: CPUC 2006-2008 Energy Efficiency Evaluation Report, July 2010 • Shareholder Reward: $211 million
Current EE Planning and Evaluation Source: Energy Division
EE goals do not align with statewide goals. Focus on energy savings leads to “treading water effect” in reaching AB32 GHG goals and lower total demand IOU administration is narrow in scope; objectives to expand ratebase conflicts with energy conservation. Lack of prioritization and targeted strategies. “All cost-effective EE” keeps portfolios stagnant Lack of Market Transformation approach for EE programs. Lack of enforcement of state’s policies Independence. Independent evaluation Changing rules EE Structural Problems
IOU EE Programs have inherent structural problems: Savings achievements do not directly translate to reduced procurement or reduced GHG emissions. Widget focus, not reduction in total energy consumption (e.g., total building or systems savings approach). Portfolio skewed toward short-term, non-peak savings (e.g., CFLs). Squander ratepayer capital: EE budget increasing at a faster pace than EE savings No strategy for ramp-down of ratepayer-subsidized rebates and transition to market forces IOU programs informed by significantly outdated assumptions IOUs received $211 million in unearned bonuses based on self-reported data Disconnect between timing of EM&V and portfolio planning Utilities utilize CPUC procedural process to continually change the rules. Consequences of Weak EE Structure
IOU Programs Inhibit Market Sustainability CFL programs subsidized for 20 years in California, now have high free ridership. Key market indicators demonstrate market transformation: high availability through multiple channels, high awareness. Market distortion: CFL programs keep prices artificially low, preventing higher quality CFLs from entering the market; sending wrong message to consumers about cost. 40 million CFLs in storage. Significant leakage resulting in arbitrage. IOU portfolios are dependent on CFLs to keep portfolios cost-effective, rather than evolving, targeted strategies. Short-term CFL savings decay quickly and can not be counted on in long-term procurement planning Residential CFLs do little to reduce peak demand The CFL Scenario
EE Strategies Don’t Align with California’s Energy Use In the 2010-2012 Portfolio: • HVAC = 30% of summer peak, but only 3% of portfolio peak savings goal (32 MW over 3 years) • Despite spending, $1M of ratepayer money, SDG&E’s savings goal for HVAC = 0 • Commercial Buildings = 38% of total energy use, but only 20% of the savings goal
Characteristics of a Successful EE Program • Focuses on Total Energy Demand Reduction. • Prioritizes EE investment. • Potential to reduce peak demand, level of risk to ratepayers, location, and duration of savings • Develops and implements market strategies: • Removes barriers to EE measure adoption • Transitions to self-sustaining EE market • Implements EE strategy and planning informed by timely market and evaluation feedback. • Utilizes a coordinated, statewide approach. • Multiple market actors
Design goals based on desired direction and magnitude of overall consumption. Prioritize EE strategies that would optimize energy savings. Remove requirement to pursue “all cost-effective EE” and replace with Prioritization and Market Transformation approach. Establish an Independent Administrator (IA) to implement Market Transformation strategies: The IA would implement Market Transformation through development and implementation of a Strategic Plan The IA would act as an air-traffic controller to coordinate relevant market actors and statewide EE effort Remove Shareholder Incentive Mechanism. DRA Recommendations
Identifying market barriers impeding the adoption of an energy efficiency measure. Introducing a market intervention to remove the market barrier. Creating an Exit Strategy to stop funding the interventions when barriers are removed and the free market takes over and becomes sustainable. Market Transformation Market Transformation is a strategy to introduce consumer demand for and sustain a market for an energy efficiency measure or strategy that replaces an existing lower efficiency energy application. Market Transformation is achieved by…
Technology Adoption Curve Derived from: http://www-rohan.sdsu.edu/~renglish/370/notes/chapt11/adoption_curve_05.gif
Market Share Windows Codes & Standards Clothes Washer CFLs Natural Baseline (free riders) Market Transformation Food Processing DHPs Consumer Electronics Commercial Real Estate Existing Building Renewal Market Transformation Dollars Invested Time Source: NEEA – Northwest Energy Efficiency Alliance
Administrative Models • Utilities have a role to play in statewide, independent model by leveraging utility-customer relationships
An administrative entity separate from IOUs capable of developing and implementing a strategic plan that prioritizes energy efficiency strategies. Must have market and business expertise and can react quickly to a changing marketplace. Expertise to work with a variety of market players to implement market transformation for priority strategies as identified by the strategic plan. Independent Administrator Expertise
Proceedings: A.08-07-021 – setting ex ante parameters A.09-11-014 – bridge funding A.09-01-019 – shareholder incentive mechanism Studies and Pilots: Macro-consumption metrics study and pilot Market transformation study and pilot Procedural Opportunities