Download
1 / 10
100 likes | 234 Views
How Thermometers Work. If you look around your house, you will find lots of different devices whose goal in life is to either detect or measure changes in temperature : The thermometer in the backyard tells you how hot or cold it is outside.

E N D
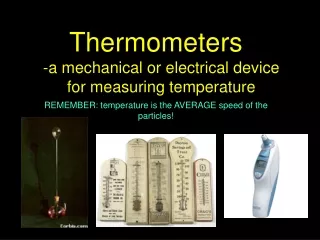
How Thermometers Work • If you look around your house, you will find lots of different devices whose goal in life is to either detect or measure changes in temperature: • The thermometer in the backyard tells you how hot or cold it is outside. • The meat and candy thermometers in the kitchen measure food temperatures. • The thermometer in the furnace tells it when to turn on and off. • The thermometer in the oven lets it keep a set temperature (hot). • The thermometer in the refrigerator lets it keep a set temperature (cold). • The fever thermometer in the medicine cabinet measures temperature accurately over a very small range.
All of these devices measure temperature in one way or another. We will look at the different thermometer technologies used today and understand how they work. You will also get to build your own thermometer!
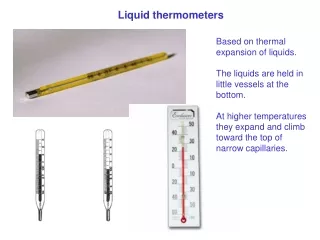
Bulb Thermometers The bulb thermometer is the common glass thermometer you probably grew up with. The thermometer contains some type of fluid, generally mercury. Bulb thermometers rely on the simple principle that a liquid changes its volume relative to its temperature. Liquids take up less space when they are cold and more space when they are warm (this same principal works for gases and is the basis of the hot air balloon.
You probably work with liquids every day, but may not notice that things like water, milk and cooking oil all take up more or less space as their temperatures change. In these cases, the change in volume is fairly small. All bulb thermometers use a fairly large bulb and a narrow tube to accentuate the change in volume.
Calibrating Thermometers - Fahrenheit • How do you calibrate the thermometer? Two common scales are used: • Fahrenheit scale - Daniel Fahrenheit arbitrarily decided that the freezing and boiling points of water would be separated by 180 degrees, and he pegged freezing water at 32 degrees. So he made a thermometer, stuck it in freezing water and marked the level of the mercury on the glass as 32 degrees. Then he stuck the same thermometer in boiling water and marked the level of the mercury as 212 degrees. He then put 180 evenly spaced marks between those two points.
Calibrating Thermometers – Celsius Celsius scale - Anders Celsius arbitrarily decided that the freezing and boiling points of water would be separated by 100 degrees, and he pegged the freezing point of water at 100 degrees. (His scale was later inverted, so the boiling point of water became 100 degrees and the freezing point became 0 degrees.)
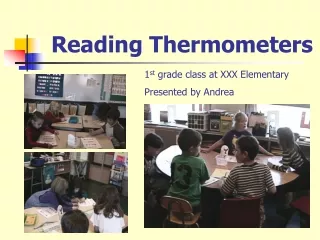
Graphing the temperature • Instructions • MAKE 5 copies of the Temperature Graph. • WRITE the day on the top of the first graph. • START from the bottom of the Fahrenheit or Celsius side of the graph (depending on the temperature data collected from the newspaper or local weather) and COLOR up until you reach the current temperature. Then do the same on the other side of the graph, coloring up to where the color stopped on the first side. • READ the degrees Fahrenheit, and the degrees Celsius. Are the numbers the same? Is the temperature the same? • GRAPH the temperature in your neighborhood for several days by REPEATING steps 2-5. Compare the temperatures from week to week. • Which day was the warmest? Which day had the coolest temperatures? • Which week was the warmest? Which week had the coolest temperatures?
Instructions • CUT out the thermometer. • PASTE it to the heavy cardboard, and cut away the extra cardboard to the size of the thermometer. • PUNCH OUT the two black dots on the top and bottom of the thermometer. • MEASURE the distance between the two holes. • CUT a piece of white yarn and a piece of red yarn, both two inches longer than the distance between the two holes. • TIE the white yarn to one end of the red yarn. • On the side with the numbers, THREAD the yarn through the top and bottom holes, making sure the red piece is at the bottom and the white on top. • TURN the thermometer to the back, and loosely tie the yarn ends together. • MOVE the yarn up and down to show different temperatures on the face of the thermometer. • PRACTICE reading the temperature in both Celsius and Fahrenheit. If it's 80 degrees Fahrenheit, how many degrees Celsius is it?