Download
1 / 37
370 likes | 489 Views
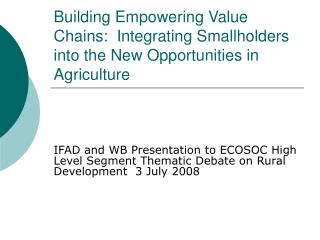
Key Messages. While there have been substantial reforms in manufactures trade, there is still high protection in agriculture. Reforms are ongoing in agriculture in most developing countries, but there is little reform in industrial and some developing countries

E N D
Key Messages • While there have been substantial reforms in manufactures trade, there is still high protection in agriculture. Reforms are ongoing in agriculture in most developing countries, but there is little reform in industrial and some developing countries • Reforms in agricultural marketing and production in developing countries will increase output, but without trade reforms this will lead to price declines and pressures for greater protection • Global agricultural reforms would generate large welfare gains and even larger changes in output, exports and imports • Multilateral and multi-commodity solutions are the key
Protection is Still High and Mostly at the Border Source: OECD
OECD Protection has not decreased significantly Estimated nominal rates of agricultural protection in OECD Countries (%) Source: OECD protection estimates (except ABARE for 1965-1974, Author’s calculation for 2000-2002).
Developing Countries’ Tariffs Have Decreased Source: TRAINS
Complicated Protection Due to Specific Duties Percentage of Tariff Lines Non Ad-Valorem Source: WTO IDB (MFN Applied Duties)
Tariff Peaks Are Very High Source: WTO IDB (MFN Applied Duties)
Tariffs Escalate in Final Products Source: WTO IDB (MFN Applied Duties)
Protection Dairy • Highest OECD support ($42.1 billion), with tariffs of 30% and higher worldwide • Myriad of instruments used (tariff, TRQ, export subsidy, price discrimination) • Dynamic market fueled by fast-growing trade in components and foreign direct investment
Protection Rice • Mature but important market • World average tariffs of 43% (217% for short/medium grain rice). Total OECD support of $24.3 billion • Prohibitive tariffs in Japan, Korea, Taiwan, EU • Tariff escalation by stage of milling in EU and LAC • High tariffs in Indonesia, India, and many net importing countries outside Middle East
Protection Cotton • Low tariffs, significant US and EU production subsidies of $4.4 billion out of $20 billion of production Sugar • World average tariff: 26.6 percent (sugar and confectionery); OECD support $5.2 billion • High domestic support and trade policies in EU, US, Japan, including TRQs, and export subsidies • 80% of production & 60% of trade at prices higher than the world price
DevelopingCountries Industrialized countries 1980/81 90/91 00/01 80/81 90/91 00/01 Agriculture Total 37.8 33.0 36.1 62.2 67.0 63.9 To Developing 13.4 10.5 13.7 18.9 14.5 15.6 To Industrialized 24.3 22.4 22.4 43.4 52.5 48.3 Manufacturing Total 19.3 22.7 33.4 80.7 77.3 66.6 To Developing 6.6 7.5 12.3 21.7 15.2 19.0 To Industrialized 12.7 15.2 21.1 59.0 Stagnating Trade Share of Developing Countries in Agriculture (percent) 62.1 47.6 Source: COMTRADE
Developing Country Exports have Surged in Non-Traditional Products with Low Protection(shares, %) • Tropical Products: Coffee, cocoa,,tea, nuts, spices, textile fibers, sugar and confectionery; • Temperate Products: Meats, milk, dairy, grains, animal feed, edible oil and oil seeds • Other Processed Products: Tobacco and cigarettes, alcoholic and non-alcoholic beverages and other processed food
Reforms would deliver large welfare gains and structural changes • Most global gains are due to agriculture and food processing • Without reforms trade surpluses will increase for industrial countries • Predicted changes in output, imports and exports are many times the welfare gains • Results are robust to changes in key assumptions
Reform Effects Cotton • Removing US and EU production subsidies is key for growth • Eliminating distortions would increase world prices by 10-20% • Expansion expected in West Africa, Central Asia, and Australia, contraction in EU, US Dairy • Removing distortions would increase world prices by 20-40% and welfare by $3.5 billion
Reform Effects Sugar • Removing all support would increase world prices by 20 to 40 percent, with aggregate welfare gains of up to $4.7 billion • Gainers: Producers in Brazil, Thailand, Latin America, Africa and Australia; consumers in US, Japan, and EU • Adjusters: Producers in US, EU, Japan, and all northern developing countries, and import quota license holders
Decoupling Support • Move to reduce tariffs and replace production linked subsidies with decoupled support payments • Little effect on output so far • Not all support replaced • No time limit and reversals • Require land to be in agricultural use
Preferences for Low Income Countries • Small number of products have large benefits (sugar, bananas) • Products and rules by major industrial countries are very different • No major diversification has taken place as a result of preferences • In Caribbean the preferences have held back diversification
Agro-Food Standards • Proliferation and tightening of standards, both official and private sector • New demands are manageable for middle-income countries and organized industries in poorer ones • 20 low and 28 lower middle countries export fish to EU with reduced inspections
Implications • Difficult to initiate reforms in developing countries without global reform • The Uruguay Round, NAFTA, and EBA, are bringing some discipline, but much deeper multilateral reform needed • Significant reduction of border protection is a crucial first step • Border reforms alone are not sufficient. Real reductions of domestic support needed—not just the “color box” game
Cotton • Mature market, slow demand growth intense competition from synthetic fiber (60 % share) • Low tariffs, significant US and EU production subsidies of $4.4 billion—trade distortions. “Reactive” support in many developing countries • Removing US and EU production subsidies is key for growth, although reforms unlikely soon • Eliminating distortions would increase world prices by 10-20% • Expansion expected in West Africa, Central Asia, and Australia, contraction in EU, US • Strong poverty links in low income countries
Dairy • Highest OECD support ($42.1 billion), with high tariffs of 30% plus worldwide • Myriad of instruments used (tariff, TRQ, export subsidy, price discrimination) • Dynamic market globally fueled by fast-growing trade in components and FDI • New trade in casein, whey, and milk components with new technology, bypassing trade barriers • Removing distortions would increase world prices by 20-40% and welfare by $3.5 billion • Relocation of production would take place away from QUAD, and High-income Asia to CAIRNS (minus Canada), and India
Groundnuts • Mature markets, cheaper vegetable oils have reduced peanut oil demand; expanding demand for confectionary nuts; • Global tariffs around 13 % for groundnuts, 11 % for groundnut oil, and 5.8 % for cake • In India tariffs of 45% on nuts and cakes, 70% on oil • Tariff escalation in China: 9.7% in-quota for oil, 75% out-of quota oil tariff, but redundant tariffs for nuts; VAT not applied to domestic output
Groundnuts • Reduced US distortion with the 2002 Farm Bill, but redundant high tariff remaining. High tariffs in smaller Asian markets (Thailand, Korea) • Removal of distortions would increase world prices by 15 to 20 percent for groundnuts, oil and cake • Who would gain? Producers in West Africa (if quality issues are resolved), Argentina, South America, and the US • Who would have to adjust? Chinese and Indian producers; EU and US consumers
Rice • Mature but important market—staple food in Asia, small-holder production, potential trade growth • World average tariffs of 43% (217% for short/medium grain rice). Total OECD support of $24.3 billion • Prohibitive tariffs in Japan, Korea, Taiwan, EU • Tariff escalation by stage of milling in EU and LAC • High tariffs in Indonesia, India, and many net importing countries outside Middle East
Rice (con’t) • Gainers will be millers in Thailand, Vietnam, and the US; competitive producers (Vietnam, China, Thailand); consumers in Indonesia, Bangladesh, Philippines, most of Africa…. • Losers will be producers in Japan and Korea; net importers of short/medium grain rice and their consumers, especially in unprotected Asia and Middle East
Rice consumer prices in net importing countries after global liberalization
Sugar • World average tariff: 26.6 percent (sugar and confectionery); OECD support $5.2 billion • High domestic support and trade policies in EU, US, Japan, including TRQs, and export subsidies • “Reactive” support caused by low prices • 80% of production & 60% of trade at prices higher than the world price. Preferential regimes affect trade patterns
Sugar (con’t) • Removing all distortions would increase world prices by 20 to 40 percent, with aggregate welfare gains of $4.7 billion and up • Who would gain? Producers in Brazil, Thailand, Latin America, Africa and Australia; consumers/users in US, Japan, EU, and other beet producing northern countries • Who would have to adjust? Producers in US, EU, Japan, and all northern developing countries. Import quota license holders, but partial compensation of lost quota rent by world price increase.
Fruits and Vegetables • Second largest export after seafood, 19% of developing country exports • Very dynamic market, decelerated in 1990 mostly due to stagnant EU demand • Almost no subsidies but complex (specific, mixed, seasonal ect.) and sometimes high tariffs • 60% of EU tariff lines on fresh vegetables are between 21%-50%; 53% in processed fruits are above 50%. • Each product export is dominated by a few developing countries • Few successful developing countries, Mexico, Chile, Turkey, China
Fruits and Vegetables (con’t) • Threat of preference erosion for ACP countries; AGOA provides limited benefits due to sanitary requirements in US. • Further tariff reform is necessary, especially in EU, but supply capacity is the key in low income countries
Seafood • Most traded food item with global exports of US$ 57 billion in 2001 • Now constitute 20% of Food&Agriculture exports of developing countries; more than all traditional exports put together • Biggest item is shrimp with global exports of US$ 10 billion in 2001 • Now, 30% of seafood production is in aquaculture • Low tariffs in most countries but subsidies to fleets of industrial countries • Little management capacity in developing countries both for sustainability and higher value added
Coffee • Liberal trade policies • Supply controls have not worked • Slow demand growth, competition from soft drinks • Demand expansion in the top (Organic, Fair Trade, gourmet) and bottom end • New entrants, (Brazil, Vietnam) and limited exit • Strong poverty links in low income countries
Wheat • Slow trade and demand growth in wheat, greater growth in flour, pasta, and bakery and much value added created in retailing • Reforms in many developing countries, but still high subsidies in US, EU and Japan ($17 billion of producer support for the OECD) and some developing countries • Significant tariff escalation in flour, pasta, bakery products, so trade is only within trading blocks such as EU, and NAFTA
Wheat (con’t) • Global reforms will increase prices by only 10-15% • Big gainers will be Argentina and CIS, some reduction by US and EU • Low stocks, and export restrictions, in time of shortages push countries towards self sufficiency