Download
1 / 5
50 likes | 180 Views
CheckImage Collaborative Communications Work Group. Key Messages: Paper checks are being transitioned to electronic images of checks at a pace that is unprecedented. Check images are currently collected in two forms, as substitute checks and as check images.

E N D
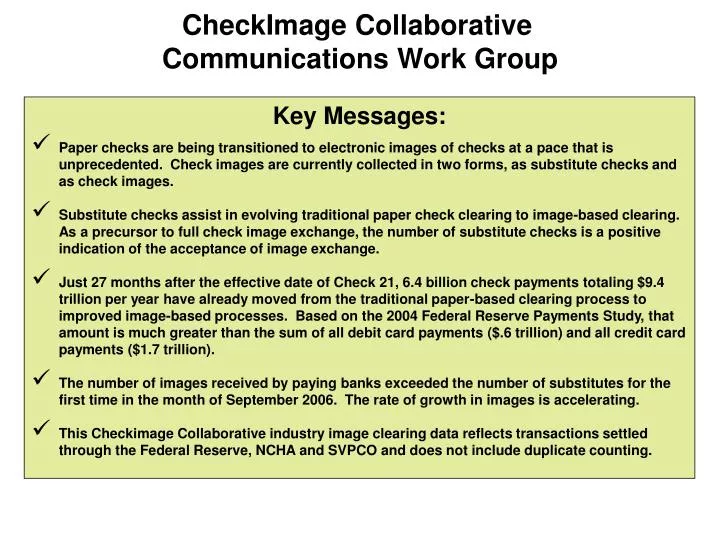
CheckImage Collaborative Communications Work Group • Key Messages: • Paper checks are being transitioned to electronic images of checks at a pace that is unprecedented. Check images are currently collected in two forms, as substitute checks and as check images. • Substitute checks assist in evolving traditional paper check clearing to image-based clearing. As a precursor to full check image exchange, the number of substitute checks is a positive indication of the acceptance of image exchange. • Just 27 months after the effective date of Check 21, 6.4 billion check payments totaling $9.4 trillion per year have already moved from the traditional paper-based clearing process to improved image-based processes. Based on the 2004 Federal Reserve Payments Study, that amount is much greater than the sum of all debit card payments ($.6 trillion) and all credit card payments ($1.7 trillion). • The number of images received by paying banks exceeded the number of substitutes for the first time in the month of September 2006. The rate of growth in images is accelerating. • This Checkimage Collaborative industry image clearing data reflects transactions settled through the Federal Reserve, NCHA and SVPCO and does not include duplicate counting.
Highlights: All checks were imaged before reconversion to substitute checks. Chart reflects volume received by DFIs for payment from other DFIs or an intermediary. Across the 13 month period Image-based clearing volume grew from 73.1 to 530.5 million / mo or by 626% with 60.2% of the volume cleared by image in January 2007. The annualized Jan ‘07 volume = 6.4 billion items/yr. is approximately 18% of total check volume cleared. # of Images & Substitute Checks Forward Collection Only 500 400 300 # Items in Millions 200 100 Data Sources: Transactions settled through the Federal Reserve, NCHA and SVPCO with no duplicate counting 0 Jul-06 Jan-06 Apr-06 Jan-07 Oct-06 Feb-06 Mar-06 Jun-06 May-06 Aug-06 Nov-06 Sep-06 Dec-06
Highlights: All checks were imaged before reconversion to substitute checks. Chart reflects checks received by DFIs for payment from other DFIs or an intermediary. The dollar amount grew from $292 to $770 billion / mo or 164%. Annualized Jan ‘07 dollar amount = $9.4 trillion/yr. $9.4 trillion is 24% of the total dollars cleared via check and is greater than the sum of all debit card and credit card payments. $800 $ Amounts of Images & Substitute Checks Forward Collection Only $700 $600 Jan $ Annualized = $9.4 Trillion $500 $ Amounts in Billions $400 $300 $200 Data Sources: Transactions settled through the Federal Reserve, NCHA and SVPCO with no duplicate counting $100 $0 Jul-06 Jan-07 Jan-06 Apr-06 Oct-06 Mar-06 Feb-06 May-06 Jun-06 Aug-06 Nov-06 Sep-06 Dec-06
Number of R/Ts Receiving Image Files Highlights: Chart reflects the number of paying bank R/Ts receiving check images. Most R/Ts through January 2007 were for individual institutions. The number of receiving R/Ts grew between Jan ’06 & Jan ‘07 from 2,692 to 6,591 or 145%. 6,591 routing transit numbers represent about 6,021 institutions. This means that approximately 36% of all U. S. institutions are receiving check images. 6,000 5,000 Image Receiving R/Ts 6,591 4,000 # of Receiving R/Ts 3,000 2,000 1,000 Data Sources: Transactions settled through the Federal Reserve, NCHA and SVPCO with no duplicate counting 0 Jul-06 Jan-06 Apr-06 Jan-07 Oct-06 May-06 Aug-06 Feb-06 Mar-06 Jun-06 Nov-06 Sep-06 Dec-06
Highlights: Chart reflects volume received by DFIs for payment from other DFIs or an intermediary. Volume grew by 111% in 4 months – September ‘06 (7.2) to January ’07 (15.2). Average daily image volume grew from .89 to 15.2 million or by 1,608% from Jan 2006 to Jan 2007. Average # of Images /Day 14.0 12.0 15.2 Million Image / Day 10.0 # Items in Millions 8.0 6.0 4.0 7.2 Million Image / Day Data Sources: Transactions settled through the Federal Reserve, NCHA and SVPCO with no duplicate counting 2.0 0.0 Jul-06 Jan-06 Jan-07 Apr-06 Oct-06 Feb-06 Mar-06 May-06 Jun-06 Aug-06 Sep-06 Nov-06 Dec-06