Download
1 / 27
270 likes | 374 Views
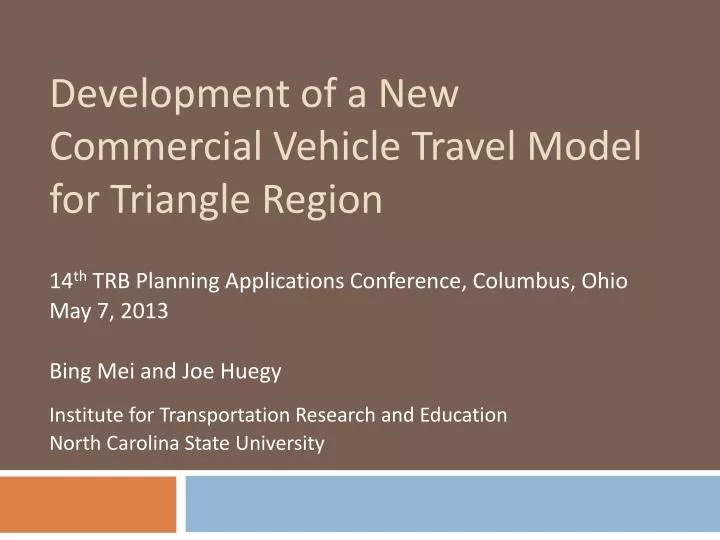
Development of a New Commercial Vehicle Travel Model for Triangle Region. 14 th TRB Planning Applications Conference, Columbus, Ohio May 7, 2013 Bing Mei and Joe Huegy Institute for Transportation Research and Education North Carolina State University. Outline.

E N D
Development of a New Commercial Vehicle Travel Model for Triangle Region 14th TRB Planning Applications Conference, Columbus, Ohio May 7, 2013 Bing Mei and Joe Huegy Institute for Transportation Research and Education North Carolina State University
Outline • 2010 commercial vehicle travel survey • Trip data imputation • Trip generation models • Trip destination choice models
Triangle Region and Model • Population: 1.6 million (2010) • Employment: 0.85 million (2010) • Area: 3,430 miles2 • Trip-based model • Traffic Analysis Zones: • Internal: 2,579 / External: 99 • Highway Network in Model: • 7,400 miles
Survey Data • 2010 Triangle Region commercial vehicle activity and travel survey • Establishment-based survey • 500 business establishments surveyed in the region • Collected a rich set of data: • Establishment data: SIC code, number of employees, number of commercial vehicles by type, locations, etc. • Vehicle data: Vehicle type, number of axles, vehicle weight, beginning and ending odometer readings, etc. • Activity/trip data: arrival and departure times at each activity location, activity location coordinates, trip purpose, goods delivered, weight of the goods, etc.
Trip Data Imputation • Only first 10 trips recorded for each vehicle • About 20% of trips unrecorded • Affects time-of-day distribution substantially • Mid-day • PM peak Note: statistics based on 436 internal business establishments
Trip Data Imputation (cont’d) • Ad hoc imputation • Simple random sampling from recorded trips made by the same vehicle • Imputed trips join originally recorded trips for: • Time-of-day analysis • Trip generation model development • Trip length frequency distribution for destination choice model calibration • NOT for destination choice model estimation
Model Design • Overall Model Design: • Three vehicle types: • light commercial vehicle (FHWA Classes 2 and 3) • single-unit truck (Classes 5, 6 and 7), and • multi-unit truck (Classes 8, 9, 10, 11, 12, and 13) • Three trip purposes: • delivery of goods • delivery of services, and • other purposes
Model Design (cont’d) FHWA Vehicle Classification
Model Design (cont’d) • Few observations in survey data set for • single-unit truck trips with other purposes • multi-unit truck trips delivering services, and • multi-unit truck trips with other purposes • Models estimated (for I-I trips only):
Trip Generation Model • High correlation among explanatory variables • Form new districts for regression based on zonal socioeconomic characteristics • A two-hierarchy methodology • 1st level: population vs. employment • 2nd level: employment ranking by type
Trip Generation Model • 1stlevel: • Population dominating • Population leading • Balanced • Employment leading • Employment dominating • 2nd level: • S50-R30: 1st – Service ~ [50%, 80%); 2nd – Retail ~ [30%, 50%) • O80-I05: 1st– Office ~ [80%, 100%); 2nd– Industrial ~ [5%, 10%) • Combined: • Population leading - S50-R30
Trip Generation Model • R-squared: 0.16 – 0.59 • Explanatory variables with t score >= 1 retained
Destination Choice Model • Explore the feasibility of developing a commercial vehicle trip distribution model with discrete choice model structure and stratified by both vehicle types and trip purposes • Considering the complexity of commercial vehicle travel, test non-impedance variables for inclusion in utility function • explicit inclusion of socio-economic, geographic, and political-boundary variables in the utility function • coefficients on those variables estimated using formal statistical processes
DC Methodology • Model Specification
DC Methodology (cont’d) • inter-county dummies – capture the strength of inter-county economic interactions • inter-area-type dummies – survey reveals larger commercial vehicles tended to travel between less developed areas Utility Function: inter-county dummies inter-area-type dummies
DC Methodology (cont’d) • Model Estimation with Importance Sampling • A sample of TAZs used for logit model estimation: • Independence of Irrelevant Alternatives (IIA) Property • Importance Sampling with Replacement (ISwR) method (Ben-Akiva and Lerman, 1985) • Rationale of ISwR: • The alternatives more likely to be chosen by decision maker have a higher probability of being selected into the sample • Selection weight
Model Performance Evaluation • Model performance evaluated based on: • Average trip lengths; • Trip length frequency distribution; and • Coincidence ratios
Model Performance Evaluation (2) Trip Length Frequency Distribution by Vehicle Type and Trip Purpose for AM Peak Period
Model Performance Evaluation (3) Trip Length Frequency Distribution by Vehicle Type and Trip Purpose for PM Peak & Off-Peak
Model Performance Evaluation (4) Coincidence ratios:
Summary • Forming districts based on zonal socioeconomic characteristics helps reduce correlation between independent variables for regression • Travel time is still the strongest determining factor for destination choice • Inter-area-type dummy variables are statistically significant in all SUT and MUT sub-models and push more SUT and MUT trips to less developed areas. • Inter-county dummy variables are statistically significant in some sub-models too • Room for improvement in the future: • Explore the explicit inclusion of economic factors in the model to improve model’s explanatory power; • Investigate the use of more disaggregated employment categories that are more consistent with NAICS or SIC; • Explore model stratification by NAICS or SIC sectors.
Thank You! Contact Info: Bing Mei, bmei@ncsu.edu, 919-513-7381 Joe Huegy, jbhuegy@ncsu.edu, 919-513-7378