Download
1 / 32
320 likes | 514 Views
TOX680 Unveiling the Transcriptome using RNA- seq. Jinze Liu. Outline. What is the transcriptome? Measuring the transcriptome Sampling the transcriptome using short reads Alignment of reads to a reference genome Splice graph representation of RNA- seq data

E N D
Outline • What is the transcriptome? • Measuring the transcriptome • Sampling the transcriptome using short reads • Alignment of reads to a reference genome • Splice graph representation of RNA-seq data • Reconstructing the transcriptome • Differential analysis of the transcriptome
Genome, Transcriptome, Proteome Schematic illustration of a eukaryotic cell Proteins Proteome The transcriptome isall RNA moleculestranscribed from DNA RNA cell nucleus DNA Genome
Dynamics of the Transcriptome • Cells with the same genome may produce a different transcriptome … how? • Two main mechanisms (1) differential gene expression (2) differential gene transcription DNA DNA pre-mRNA mRNA transcripts mRNA Proteins Proteins
Alternate transcription • multiple mRNA transcript “isoforms” within one gene • proteins with different functions may be produced • e.g. skipped exon in CYT-2 isoform of ERBB4 leads to increased cell proliferation CYT-2: deletes 16 amino acids (WW domain binding motif) Muraoka-Cook et al. (2009) Mol Cell Biol
Forms of alternative splicing Castle et al. (2008) Nature Genetics Gene VEGFA combines multiple alternative splicing forms (not independently!) …. 2 2 3 3 2
How to measure the transcriptome? • Ideally, given a sample of RNA • which transcripts are present? • how much of each? • Given two samples of RNA • which transcripts are differentially expressed?
Microarrays • Most common technique for measuring transcriptome • hybridized probes detect the presence and abundance of specific known transcripts • difficult to observe differenttranscript isoforms • abundance has limited dynamic range
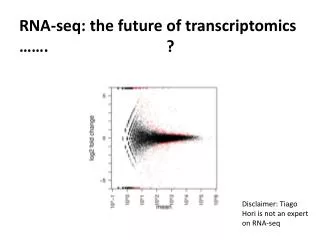
Differential gene expression • Identify transcriptome differences between two samples
Outline • What is the transcriptome • Measuring the transcriptome • Sampling the transcriptome using short reads • Alignment of reads to a reference genome • Splice graph representation of RNA-seq data • Reconstructing the transcriptome • Differential analysis of the transcriptome
Protocol mRNA is reverse transcribed to cDNA cDNA is randomly fragmented adapters are added to the fragments fragments are sequenced using HT sequencing technology e.g. Illumina: up to a billion 100bp reads sequenced in a single run Each sequence is a randomly sampled fragment of the transcriptome identity determined by alignment to a transcript library or to a reference genome the number of alignments toa genomic locus is a measure ofabundance The RNA-seq protocol Nature Review | Genetics
RNA-seq view of transcriptome • Issues • non-random fragmentation • sequencing bias • DNA or pre-mRNA contamination • Spliced alignments • not a problem if aligning to a transcript library • challenging if aligning to the genome
Outline • What is the transcriptome • Measuring the transcriptome • Sampling the transcriptome using short reads • Alignment of reads to a reference genome • Splice graph representation of RNA-seq data • Reconstructing the transcriptome • Differential analysis of the transcriptome
Spliced alignment strategies • Annotation based discovery • contiguous alignment of reads to existing EST/cDNA sequences with known splice junctions • contiguous alignment of reads to paired exons from database of known or suspected junctions (Mortazavi et al. 2008, Wang et al. 2008) • Ab initio discovery by alignment to reference genome • QPalma (Bona et al. 2008) • supervised splice site prediction and gapped alignment algorithm for aligning spliced reads • TopHat (Trapnell et al. 2009) • detect potential junctions based on structural features of introns, e.g. GT – AG dinucleotide sequences flanking the exons • test alignment of reads to candidate exon pairs
Improved splice detection • Issues • Can not easily find non-canonical splices or long-range splices • Single long reads may include multiple splice junctions • Spurious alignment is a serious problem • MapSplice: a second generation ab initio method • alignment of reads • does not depend on any structural features • finds multiple candidate alignments • splice inference • leverages the quality and diversity of read alignments to disambiguate true junctions from spurious junctions • efficient and scalable
Finding spliced alignments • Example: 100bp tag T is split into 25bp segments • segments are tested for (approximate) alignment to the genome • unaligned segments implicate splices • find splices by searching from neighboring aligned segments • Theorem: if no exon is shorter than 2k, then at least one segment must align in every pair of consecutive length k segments. t1 t2 t3 t4 mRNA tag T h j1 k k j2 Genome exon 1 exon 2 exon 3
Contiguous tj+2 tj tj+1 5’ 3’ Missed alignment double anchored ? tj+1 tj tj+2 Missed alignment single anchored ? tj+1 tj MapSplice algorithm (1) INPUTS set of RNA-Seqreads T1 Reference genome T2 … Ti tn t1 t2 tj (1) Segmentation of reads … … Ti (2) Segment exonic alignment (3) Segment spliced alignment tj tj+1 5’ 3’ ? tj+1 tj tj+2 5’ 3’ ? tj+1 tj s(j+1)
MapSplice algorithm (2) (4) Segment assembly tj t1 tn-1 t2 tj+1 tn … … 5’ 3’ Ti … … (5) Junction inference • Alignment quality • Anchor significance • Entropy Ti2 Ti Ti Ti3 Ti4 5’ 3’ High Confidence Low confidence (6) Identify best alignment for tags OUTPUTS: Splices and splice coverage Read alignments Ti 5’ 3’
Validating the algorithm • How can we tell if it is working well? • comparison against transcriptome library alignment • but how do we know that novel alignments are valid? • run on synthetic transcriptome for which we know ground truth! unaligned 10.2% BWA MPS identically aligned 80.4% BWA aligned only 1.2% MapSplicealigned only 5.0% /6.8% by both 81.4%
Synthetic Transcriptome • Sample each gene’s ABUNDANCE from Wang et al. (2008) • Choose a DISTRIBUTION across annotated transcript isoforms in RefSeq • Randomly pick the START position for each read (& introduce errors) • Align reads with MapSplice and analyze performance.
Improved accuracy from multiple criteria in junction classification
Outline • What is the transcriptome • Measuring the transcriptome • Sampling the transcriptome using short reads • Alignment of reads to a reference genome • Splice graph representation of RNA-seq data • Reconstructing the transcriptome • Differential analysis of the transcriptome
Transcriptome changes in response to time, disease, etc • Characteristics of a transcriptome • Qualitatively, which transcripts are expressed • Quantitatively, what are their expression levels Splicing Ratio 1 2 3 4 Transcript Abundance 1 2 3 4 1 3 4 transcript α transcript β Protein Expression Protein α Protein β
Transcriptome changes in response to time, disease, etc • Differential Splicing: alternative splicing events that exhibit significantly different splicing ratios between different samples Normal Tumor Splicing Ratio Differential Splicing 1 2 3 4 1 2 3 4 Transcript Abundance 1 1 2 2 3 3 4 4 1 1 3 3 4 4 transcript α transcript β transcript α transcript β Protein Expression Protein α Protein β Protein α Protein β
Differential Splicing: why important? • Understanding of cell differentiation and development • Identification of disease biomarkers Normal Tumor Splicing Ratio Differential Splicing 1 2 3 4 1 2 3 4 Transcript Abundance 1 1 2 2 3 3 4 4 1 1 3 3 4 4 transcript α transcript β transcript α transcript β Protein Expression Protein α Protein β Protein α Protein β
DiffSplice – Unified Graph Representation RNA-seq readalignment A1 Group A 5’ 3’ Reference genome A2 B1 Group B Observed read coverage B2 J1 J2 J4 E1 E2 E3 E4 E5 J3 J5 Splice structure Unify structural information (exons and junctions) from all samples
DiffSplice – Unified Graph Representation Splice structure Unified Expression-weighted Splice Graph (ESG) J1 J2 J4 J3 J5 Differentiate samples by the weights • Weighted DAG (Directed Acyclic Graph) • Vertex – Exonic segment • Edge – Splice junction • Weight – Expression level J1 J2 J4 E1 E2 E3 E4 E5 E1 J1 E2 94.9 91 95.2 A1 J3 J5 Group A 83.7 84 88.1 A2 TS E1 E2 E3 E4 E5 TE 56.1 57 55.7 B1 Group B 62.2 64 65.6 B2
DiffSplice– Alternative Splicing Modules (ASMs) ESG J1 J2 J1 J2 J4 J4 J3 immed. pre-dominator immed. pre-dominator ASM E3 TE E1 E3 J3 J5 J5 immed. post-dominator immed. post-dominator ASM1 ASM2 TS E1 E1 E2 E2 E3 E3 E3 E4 E4 E5 E5 TE TE source sink source sink
DiffSplice– Alternative Splicing Modules (ASMs) Level 0 ESG J1 J2 J1 J2 J4 J4 ASM1 ASM2 J3 ASM J3 J5 J5 path 1 path 1 Level 1 ASM1 ASM2 TS E1 E1 E2 E2 E3 E3 E3 E4 E4 E5 E5 TE TE source sink source sink path 2 path 2
DiffSplice – Isoform Abundance Estimation ASM1 in sample A1 path 1 N, q Poisson dist’n 91 93 observed expression J1 J1 J2 J2 T1 T2 92.1 Normal dist’n 94.9 95.2 3 w(E1) w(E2) w(E3) w(J1) w(J2) w(J3) J3 J3 path 2 path 1 estimated expression ? (?%) E1 E1 E2 E2 E3 E3 ? (?%) path 2
DiffSplice – Isoform Abundance Estimation ASM1 in sample A1 path 1 91 93 observed expression J1 J1 J2 J2 92.1 94.9 95.2 3 J3 J3 path 2 path 1 alternative path proportion estimated expression 92.0 (96.7%) 96.7% 3.3% estimated expression of ASM1 E1 E1 E2 E2 E3 E3 3.1 (3.3%) 95.1 path 2