Download
1 / 41
410 likes | 546 Views
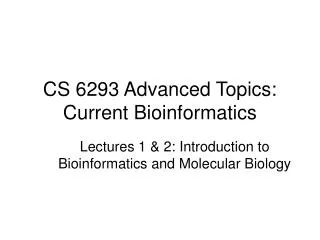
IMGS 2012 Bioinformatics Workshop: RNA Seq using Galaxy. Typical RNA_Seq Project Work Flow. Tissue Sample. Total RNA. mRNA. cDNA. Sequencing. FASTQ file. QC. Visualization. TopHat. Focus for Today. Cufflinks. Gene/Transcript/ Exon Expression. Statistical Analysis.

E N D
Typical RNA_Seq Project Work Flow Tissue Sample Total RNA mRNA cDNA Sequencing FASTQ file QC Visualization TopHat Focus for Today Cufflinks Gene/Transcript/Exon Expression Statistical Analysis JAX Computational Sciences Service
RNASeqTasks, Tools and File Formats File Format Tool Task Quality Control FastQ, SangerFastQ FastQC TopHat Alignment SAM/BAM IGV Cufflinks Summarization GTF Cuffdiff,Edge, DESeq, baySeq Differential Gene Expression
Dialog/Parameter Selection History Tools
ftp://ftp.ncbi.nlm.nih.gov/pub/church/GenomeAnalysis/h1-hESC_Sample_Dataset.fastqftp://ftp.ncbi.nlm.nih.gov/pub/church/GenomeAnalysis/h1-hESC_Sample_Dataset.fastq
Data upload review Our data are H1 human embryonic stem cell RNA Seq data from the CalTech encode project. Single end reads from Illumina.
Typical RNA_Seq Project Work Flow Tissue Sample Total RNA mRNA cDNA Sequencing FASTQ file QC Visualization TopHat Cufflinks Gene/Transcript/Exon Expression Statistical Analysis JAX Computational Sciences Service
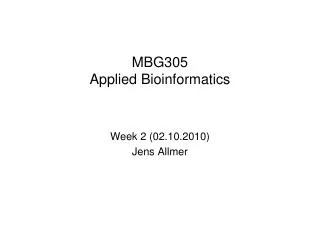
Prior to alignment, perform some quality control (QC) assessments of the data. Here we use FastQC **. **http://www.bioinformatics.babraham.ac.uk/projects/fastqc/
FastQC provides a wide range of QC checks. Here we will only look at “Per base sequence quality”
Sequence quality per base position • Good data • Consistent • High Quality Along the reads • Bad data • High Variance • Quality Decrease with Length • The central red line is the median value • The yellow box represents the inter-quartile range (25-75%) • The upper and lower whiskers represent the 10% and 90% points • The blue line represents the mean quality
Quality Score Our data… Position along sequencing read
Galaxy has several tools for trimming sequences, removing adapters, etc. prior to alignment. Using the information from FastQC, let’s trim our input sequences so that the aggregate quality score is 15.
Typical RNA_Seq Project Work Flow Tissue Sample Total RNA mRNA cDNA Sequencing FASTQ file QC Visualization TopHat Cufflinks Gene/Transcript/Exon Expression Statistical Analysis JAX Computational Sciences Service
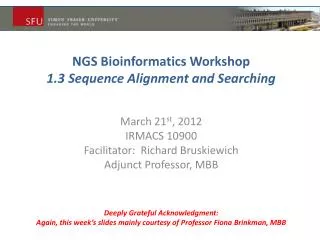
TopHat http://tophat.cbcb.umd.edu/ TopHat is a good tool for aligning RNA Seq data compared to other aligners (Maq, BWA) because it takes splicing into account during the alignment process. Figure from: Trapnell et al. (2010). Nature Biotechnology 28:511-515. Trapnell et al. (2009). Bioinformatics 25:1105-1111.
Setting parameters for TopHat in Galaxy Be sure to use the quality trimmed sequences!
Does it seem like your Galaxy jobs never finish?! Galaxy is increasingly popular so it can take time for some of these computationally expensive processes to run…don’t restart your job or you will go to the end of the line! Your job will continue to run on the Galaxy servers even if you shut down your computer.
For now we have pre-computed data to illustrate the main points!
Visualizing alignments in Galaxy When TopHat finishes the alignments are available in BAM format.
You can look at the alignments in a variety of browsers…. Which browser you choose is a matter of personal preference.
UCSC Browser…the track and the title of the track are made automatically for you from Galaxy. UCSC also has controls to let you display many other kinds of annotations as tracks. chr19:2,373,346-2,398,357
Click on an element in the TopHat track to see the details of the alignment…all of this information is stored in that very compact BAM file!!!
Typical RNA_Seq Project Work Flow Tissue Sample Total RNA mRNA cDNA Sequencing FASTQ file QC Visualization TopHat Cufflinks Gene/Transcript/Exon Expression Statistical Analysis JAX Computational Sciences Service
Cufflinks http://cufflinks.cbcb.umd.edu/ • Assembles transcripts, • Estimates their abundances, and • Tests for differential expression and regulation in RNA-Seq samples Trapnell et al. (2010). Nature Biotechnology 28:511-515.
There are several ways to generate annotation files for Cufflinks to use. Here we will create an annotation file using the UCSC genome browser tool in Galaxy. A B There are many options for the features to include in the annotation file. Cufflinks expects a GTF file format
Once you have selected your annotations…you can send them directly to your history in Galaxy.
Setting parameters for Cufflinks Use the reference annotations you just downloaded…
Example of an RNA Seq data set in NCBI’s Gene Expression Omnibus (GEO)…you don’t always need the raw sequences to do RNA Seq, you can start with a SAM or BAM file. http://www.ncbi.nlm.nih.gov/geo/query/acc.cgi?acc=GSM521256
SAM files need to be converted into BAM format in order to run Cufflinks…. There’s a tool in Galaxy for that!!
RPKM vs FPKM • Reads Per Kilobase of transcript per Million mapped reads (RPKM) • Used for single end sequencing reads • Count # of uniquely mappable reads to a set of exons that constitute a gene prediction/model. • Fragments Per Kilobase of exon per Million fragments mapped (FPKM) • Used for paired-end sequence data • FPKM is an estimate of the number of reads per transcript • TopHat aligns reads to the genome • Cufflinks assembles reads into transcript models/fragments • Cufflinks counts the number of reads per fragment to estimate FPKM • FPKM is used as an indication of expression level for a gene
Quantification of gene expression using RNA Seq can be complicated by reads that don’t map uniquely to the genome. RNA Seq by Expectation Maximization (RSEM) takes mapping uncertainty into account when estimating expression levels.
Typical RNA_Seq Project Work Flow Tissue Sample Total RNA mRNA cDNA Sequencing FASTQ file QC Visualization TopHat Cufflinks Gene/Transcript/Exon Expression Statistical Analysis JAX Computational Sciences Service
Differential Gene Expression For RNA Seq data from multiple conditions, Cuffdiff can be used to detect significant differences in transcript expression.. Is the abundance of transcripts different between two samples?
Is there a difference in total expression of a given gene due to treatment conditions? • edgeR • DESeq • Bayseq http://www.ijbcb.org/DEB/php/onlinetool.php
Summing Up • Alignments, Assemblies, and Annotations are essential to using Next Gen sequence data for biological investigation • Know the strengths and weaknesses of each Have Fun! But Be Careful! Don’t just go along for the ride!
Tutorial Web Site http://www.ncbi.nlm.nih.gov/staff/church/GenomeAnalysis/index.shtml This site will be accessible after the meeting. Check back for updates and new tutorials.
SEQanswers is a very active public discussion board on sequence analysis issues. http://seqanswers.com/