Download
1 / 7
70 likes | 207 Views
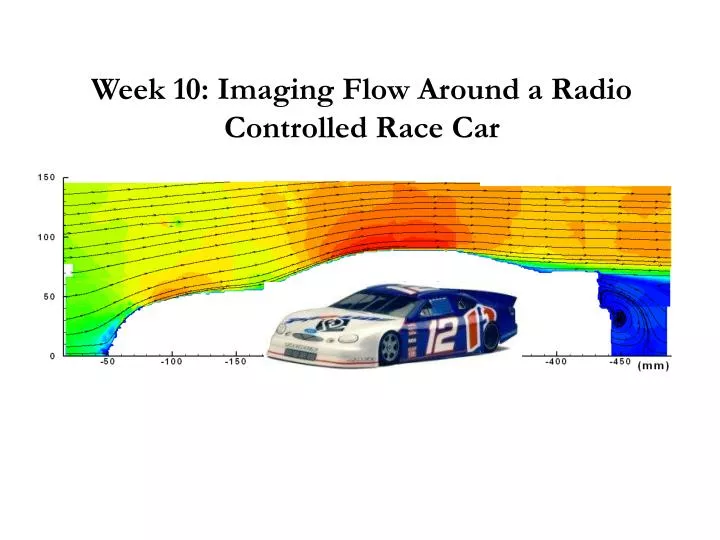
Week 10: Imaging Flow Around a Radio Controlled Race Car. The purpose of this lab is to: learn about PIV techniques, make instantaneous full field velocity measurements of flow around a model race car Continue your CFD simulations. Particle Image Velocimetry

E N D
The purpose of this lab is to: • learn about PIV techniques, • make instantaneous full field velocity measurements of flow around a model race car • Continue your CFD simulations.
Particle Image Velocimetry • Particle Image Velocimetry (PIV) is a quantitative flow visualization technique which allows for full field quantitative measurement of fluid velocities. • Other techniques are single point methods: • hot-wire anemometry (HWA) • laser-Doppler anemometry (LDA) • pitot probes
PIV Configuration • a light source (usually a double-pulse laser), • light-sheet optics (beam combining optics, beam delivery, and light-sheet formation optics), • tracer particles • camera (imaging lens and recording media). http://www.youtube.com/watch?v=BcueRJml30c
In PIV, the fluid to be studied is seeded with small, neutrally buoyant particles upstream of the zone of interest. The zone is illuminated by a light sheet which is pulsed at two known intervals. The initial pulse freezes images of the first position of the seed particles onto a camera; the second pulse records images at the particles final position.(see Figure 2) The two camera images show the initial and final positions of the particle as it moves through the flow field.
The images are then processed using a Correlation Technique to find the velocity vector map of the flow field as shown below.
Today • PIV DEMO and CFD Work • Finalize Memo CFD (due Friday)