Download
1 / 8
80 likes | 181 Views
Supplementary Information Tables 1-7 Adora2b-elicited Per2 stabilization promotes a HIF-dependent metabolic switch critical for myocardial adaptation to ischemia

E N D
Supplementary Information Tables 1-7 Adora2b-elicited Per2 stabilization promotes a HIF-dependent metabolic switch critical for myocardial adaptation to ischemia Tobias Eckle, Katherine Hartmann, Stephanie Bonney, Susan Reithel, Michel Mittelbronn, Lori A. Walker, Brian D. Lowes, Jun Han, Christoph H. Borchers, Peter M. Buttrick, Douglas J. Kominsky, Sean P. Colgan and Holger K. Eltzschig
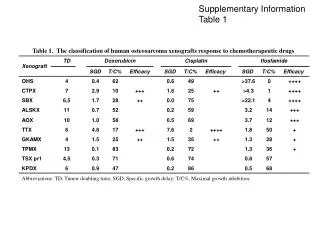
Suppl. Table 1 a b Table S1. Patient characteristics from healthy heart donors (a) or patients receiving orthotopic heart transplantation for severe ischemic cardiomyopathy (b). Collection and use of patient samples were approved by the appropriate IRB of each institution. Moreover, the study was approved by the Colorado Multiple Institutional Review Board (COMIRB). Heart tissue was analyzed for ADORA1, ADORA2A, ADORA2B, ADORA3 (Fig. 1a), or PER2 transcript and protein levels (Fig. 1h).
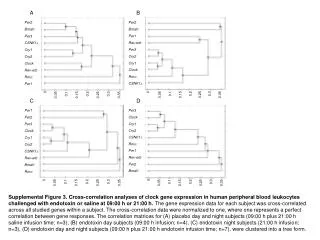
Suppl. Table 2 Table S2. Microarray analysis. Wildtype mice or gene-targeted mice for the Adora2b (Adora2b-/- ) were exposed to ischemic preconditioning (4 cycles consistent of 5min ischemia followed by 5 min of reperfusion). Following two hours of reperfusion, cardiac biopsies from preconditioned myocardium were compared to control biopsies without preconditioning. Displayed are the top 5 differentially regulated genes (induction in wildtype mice, attenuated induction in Adora2b-/- mice; n=6 mice per group, mRNA was pooled and 3 arrays per condition were obtained; published online January 14th 2010, NCBI, Gene Expression Omnibus, http://www.ncbi.nlm.nih.gov/geo/query/acc.cgi?acc=GSE19875). Changes in gene expression are displayed as fold change. Confirmation by real-time RT-PCR and Western blotting (data not shown);* p < 0.05.
Human primer sequences used in RT-PCR Forward Primer Reverse Primer PER2 5'-AATCCGCTACCACCCCTTCC-3' 5'-CGCCCTTTCATCCACATCCT-3' ADORA1 5'-TGCACTGGCCTGTTCTGTAG-3' 5'-CTGCCTCTCCCACGTACAAT-3' ADORA2A 5'- GGAGTTTGCCCCTTCCTAAG-3' 5'- CTGCTTCCTCAGAACCCAAG-3' ADORA2B 5'- ATCTCCAGGTATCTTCTC-3' 5'- GTTGGCATAATCCACACAG-3' ADORA3 5'-CTTGATTACTTCCACTGAGGTGG-3' 5'-CAACATCTTCTAGGCATCCTCC-3' CSN5 5’-TACGACAAGAAACAGCAGCAA-3’ 5’-TCCTAGCATCAGACCCATCAC-3’ 5'- GGTGGCTTTTAGGATGGCAAG -3' 5'-ACTGGAACGGTGAAGGTGACAG-3' ACTB PER2=period homolog 2 (Drosophila) ADORA1=adenosine A1 receptor (A1), ADORA2A=adenosine A2A receptor (A2A) ADORA2B=adenosine A2B receptor (A2B), ADORA3=adenosine A3 receptor (A3) CSN5=COP9 constitutive photomorphogenic homolog subunit 5 (Arabidopsis,COPS5) ACTB=actin, beta Suppl. Table 3 Table S3. Human RT PCR primer sets.
Suppl. Table 4 Table S4. siRNA oligonucleotide sequences.
Suppl. Table 5 Table S5. Murine RT PCR primer sets
Suppl. Table 6 Table S6. Consequences of Period 2 deficiency on cardiac metabolism during myocardial ischemia and reperfusion. Per2-/- mice or littermate controls matched in age, weight and gender were subjected to IP, ischemia alone or ischemia with IP (IP; 4 cycles of 5 min ischemia followed by 5 min of reperfusion). Cardiac transcript levels of glycolytic enzymes determined by real-time RT-PCR relative to Actb and expressed as fold induction relative to sham-operated controls (mean±SD n=3).
Suppl. Table 7 Table S7. Metabolic liquid chromatography - mass spectrometry data. All heart samples in the homogenizing solution had exactly the same concentration (25 mg heart tissue per mL) . The same volume from the supernatants of these tissue extract ions were used for subsequent LC-MS analyses at the same time. Comparing the peak area(s) of each metabolite in each sample is accurate for quantitation of the results; LC-MS relative peak areas or ratios of relative peak areas per 25 mg mouse heart tissue; C= control, WT=wildtype, KO= Per2-/-; significant differences are shown in Figure 4 or Supplementary Figure 15; mean +-SD, n=3.