Download
1 / 2
20 likes | 87 Views
How has the global landscape been evolving economically? This is the main question that hopefully can be answered through the following statistics based in Singapore.

E N D
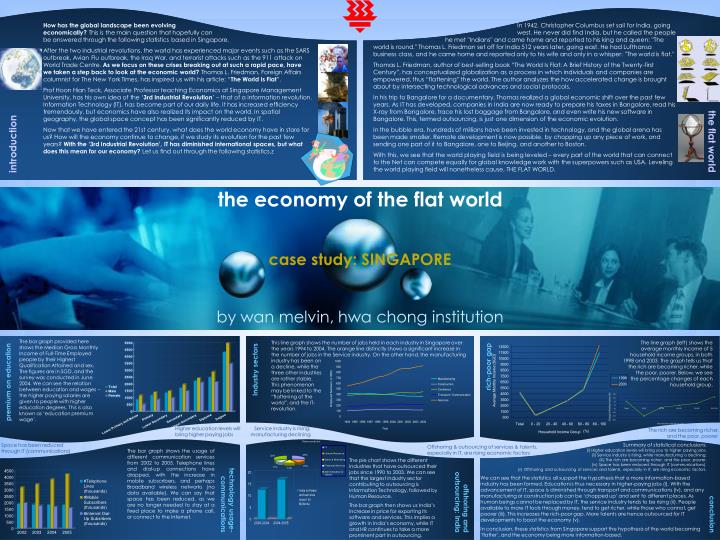
How has the global landscape been evolving economically? This is the main question that hopefully can be answered through the following statistics based in Singapore. After the two industrial revolutions, the world has experienced major events such as the SARS outbreak, Avian Flu outbreak, the Iraq War, and terrorist attacks such as the 911 attack on World Trade Centre. As we focus on these crises breaking out at such a rapid pace, have we taken a step back to look at the economic world? Thomas L. Friedman, Foreign Affairs columnist for The New York Times, has inspired us with his article: “The World Is Flat”. Prof Hoon Hian Teck, Associate Professor teaching Economics at Singapore Management University, has his own idea of the ‘3rd Industrial Revolution’ – that of a information revolution. Information Technology (IT), has become part of our daily life. It has increased efficiency tremendously, but economics have also realized its impact on the world. In spatial geography, the global space concept has been significantly reduced by IT. Now that we have entered the 21st century, what does the world economy have in store for us? How will the economy continue to change, if we study its evolution for the past few years? With the ‘3rd Industrial Revolution’, IT has diminished international spaces, but what does this mean for our economy? Let us find out through the following statistics.z In 1942, Christopher Columbus set sail for India, going west. He never did find India, but he called the people he met ''Indians'' and came home and reported to his king and queen: ''The world is round.'' Thomas L. Friedman set off for India 512 years later, going east. He had Lufthansa business class, and he came home and reported only to his wife and only in a whisper: ''The world is flat.'' Thomas L. Friedman, author of best-selling book “The World Is Flat: A Brief History of the Twenty-first Century”, has conceptualized globalization as a process in which individuals and companies are empowered, thus “flattening” the world. The author analyzes the how accelerated change is brought about by intersecting technological advances and social protocols. In his trip to Bangalore for a documentary, Thomas realized a global economic shift over the past few years. As IT has developed, companies in India are now ready to prepare his taxes in Bangalore, read his X-ray from Bangalore, trace his lost baggage from Bangalore, and even write his new software in Bangalore. This, termed outsourcing, is just one dimension of the economic evolution. In the bubble era, hundreds of millions have been invested in technology, and the global arena has been made smaller. Remote development is now possible, by chopping up any piece of work, and sending one part of it to Bangalore, one to Beijing, and another to Boston. With this, we see that the world playing field is being leveled – every part of the world that can connect to the Net can compete equally for global knowledge work with the superpowers such as USA. Leveling the world playing field will nonetheless cause, THE FLAT WORLD. introduction the flat world The bar graph provided here shows the Median Gross Monthly Income of Full-Time Employed people by their Highest Qualification Attained and sex. The figures are in SGD, and the survey was conducted in June 2004. We can see the relation between education and wages – the higher paying salaries are given to people with higher education degrees. This is also known as ‘education premium wage’. This line graph shows the number of jobs held in each industry in Singapore over the years 1994 to 2004. The orange line distinctly shows a significant increase in the number of jobs in the Service industry. On the other hand, the manufacturing industry has been on a decline, while the three other industries are rather stable. This phenomenon may be linked to the “flattening of theworld”, and the IT-revolution. The line graph (left) shows the average monthly income of 5 household income groups, in both 1998 and 2003. The graph tells us that the rich are becoming richer, while the poor, poorer. Below, we see the percentage changes of each household group. rich-poor gap premium on education Industry sectors Higher education levels will bring higher paying jobs Service industry is rising; manufacturing declining The rich are becoming richer, and the poor, poorer (%) Summary of statistical conclusions:(i) Higher education levels will bring you to higher paying jobs. (ii) Service industry is rising, while manufacturing is declining. (iii) The rich are becoming richer, and the poor, poorer. (iv) Space has been reduced through IT (communications). (v) Offshoring and outsourcing of services and talents, especially in IT, are rising economic factors. We can see that the statistics all support the hypothesis that a more information-based industry has been formed. Education is thus necessary in higher-paying jobs (i). With the advancement of IT, space is diminished through transport and communications (iv), and any manufacturing or construction job can be ‘chopped up’ and sent to different places. As human beings cannot be replaced by IT, the service industry tends to be rising (ii). People available to more IT tools through money, tend to get richer, while those who cannot, get poorer (iii). This increases the rich-poor gap. More talents are hence outsourced for IT developments to boost the economy (v). In conclusion, these statistics from Singapore support the hypothesis of the world becoming ‘flatter’, and the economy being more information-based. Space has been reduced through IT (communications) • Offshoring & outsourcing of services & talents, especially in IT, are rising economic factors The bar graph shows the usage of different communication services from 2002 to 2005. Telephone lines and dial-up connections have dropped, with the increase in mobile subscribers, and perhaps Broadband wireless networks (no data available). We can say that space has been reduced, as we are no longer needed to stay at a fixed place to make a phone call, or connect to the Internet. The pie chart shows the different industries that have outsourced their jobs since 1990 to 2003. We can see that the largest industry sector contributing to outsourcing is Information Technology, followed by Human Resource. The bar graph then shows us India’s increase in price for exporting its software and services. This implies a growth in India’s economy, while IT and HR continues to take a more prominent part in outsourcing. technology usage-communications offshoring and outsourcing: India conclusion
Bibliography • Singapore Government: Ministry of Manpower (2006), Ministry of Manpower [On-Line] Available: http://www.mom.gov.sg/ (16 March 2006) • Singapore Department of Statistics (2006), Statistics Singapore – Keystats Content Page [On-Line]Available: http://www.singstat.gov.sg/keystats/keystats.html (16 March 2006) • Introduction: • http://www.thomaslfriedman.com/worldisflat.htm • http://www.nytimes.com/2005/04/03/magazine/03DOMINANCE.html?ex=1270267200&en=cc2a00c4d9325374&ei=5088&partner=rssnyt • http://en.wikipedia.org/wiki/The_World_Is_Flat#How_the_World_Became_Flat • Education: • http://www.mom.gov.sg/NR/rdonlyres/64406C8E-289B-444C-98FF-A343275407C4/2234/2004LF_t15.pdf • Industry sectors: • http://www.mom.gov.sg/NR/rdonlyres/64406C8E-289B-444C-98FF-A343275407C4/2238/2004LF_t19.pdf • Rich-poor gap: • http://www.singstat.gov.sg/keystats/hes/chapter2.pdf • Telecommunications/IT: • http://www.singstat.gov.sg/keystats/mqstats/ess/aesa131.pdf • India outsource/offshore: • Cyber Futuristics India Pte Ltd. (2004), Outsourcing Statistics [On-Line] Available:http://www.cyfuture.com/outsourcing-statistics.htm (16 March 2006) • Gary Endelman, NASSCOM (2006), NASSCOM – Fall Guy: U.S. Immigration and the Myth of Offshoring [On-Line] Available: http://www.nasscom.org/artdisplay.asp?Art_id=2047 (16 March 2006) Prof Hoon Hian Teck, Associate Professor of Economics, Singapore Management University • Pictures from: • http://www.moneygram.com/servlet/DefaultApplyXSL?xslURL=/Display/temgweb.xsl&URL=/Document/p2__CompanyInformation.xml • http://jameshudnall.com/blog.php?/weblog/C47/ • http://www.rtnda.org/sow/index.shtml • http://www.robert-fisk.com/iraqwarvictims_page20.htm • http://www.section508.gov/docs/JulieShaw_files/TextOnly/Slide1.html • http://www.thisintothat.com/gallery/sculpture.html# *All websites were last visited on 16 March 2006.