Download
1 / 28
280 likes | 359 Views
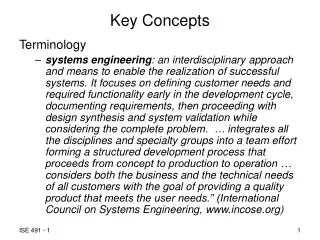
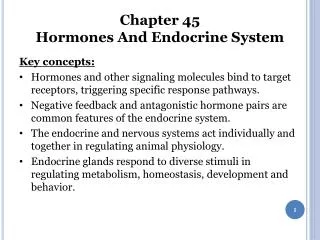
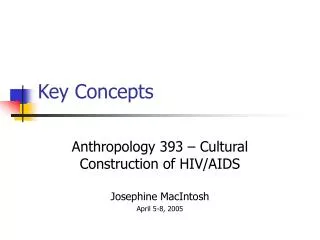
APES Key Concepts. Questions 1-12 (Fall). Sketch a drawing that illustrates the concept of range of tolerance for a population of organisms. Sketch a generalized soil profile. Identify and describe each of the horizons.

E N D
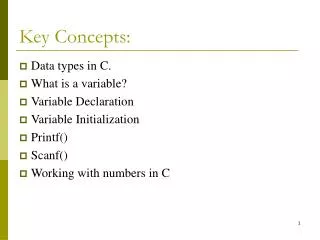
Questions 1-12 (Fall) • Sketch a drawing that illustrates the concept of range of tolerance for a population of organisms. • Sketch a generalized soil profile. Identify and describe each of the horizons. • Diagram the nitrogen cycle. Explain how human activities impact the nitrogen cycle. • Diagram the carbon cycle. Explain how human activities impact the carbon cycle. Outline the connections between global warming & the carbon cycle. • List and describe 7 ecosystem services. • Produce a sketch that illustrates the major life zones in the ocean. • Produce a sketch that illustrates the life zones in lake. • Make a sketch of a population age-structure diagram. Explain how these diagrams can predict population growth. • Sketch the demographic transition model. Label each of the 4 stages. • Assume the population of the world is 7.0 billion and growing at a rate of 1.2% how long will it take for the population to double? If this growth rate continues, what would the world’s population be in the year 2187? • The country of Apesland has a crude birth rate of 55 and a crude death rate of 30, with equal distribution of males and females.a) Calculate the percent growth rate. Show your work.b) Assuming the growth rate stays constant, calculate the time in years for the population to double.c) In which stage of the demographic transition model would you place Apesland?d) Describe some of the likely living conditions in the country of Apesland.d) Sketch a likely population age-structure diagram for this country.e) Consider your answer for part b. Based on its stage in the demographic transition model, is this a realistic estimate of the doubling time for this country? Explain. • Beginning with Chapter 1, turn through the pages and review the major diagrams. Summarize in your mind the main points of each of the graphics. No written response required.
1. Lower limit of tolerance Upper limit of tolerance No organisms Few organisms Few organisms No organisms Abundance of organisms Population Size Zone of intolerance Zone of intolerance Optimum range Zone of physiological stress Zone of physiological stress Low Temperature High Fig. 3-11, p. 43
2. Woodsorrel Lords and ladies Oak tree Dog violet Organic debris builds up Earthworm Grasses and small shrubs Rock fragments Millipede Moss and lichen Mole Fern Honey fungus O horizon Leaf litter A horizon Topsoil Bedrock B horizon Subsoil Immature soil Regolith Young soil Pseudoscorpion C horizon Parent material Mite Nematode Root system Actinomycetes Red earth mite Springtail Fungus Fig. 3-21, p. 51 Mature soil Bacteria
Gaseous Nitrogen (N2) in Atmosphere Nitrogen Fixation by industry for agriculture Food Webs on Land uptake by autotrophs uptake by autotrophs excretion, death, decomposition Fertilizers Nitrogen Fixation bacteria convert N2 to ammonia (NH3); this dissolves to form ammonium (NH4+) Denitrification by bacteria NO3– in Soil Nitrogenous Wastes, Remains in Soil Ammonification bacteria, fungi convert the residues to NH3; this dissolves to form NH4+ 2. Nitrification bacteria convert NO2– to nitrate (NO3–) NH3, NH4+ in Soil 1. Nitrification bacteria convert NH4+ to nitrite (NO2–) NO2– in Soil loss by leaching loss by leaching 3. Fig. 3-27, p. 58
7. Littoral
9. Stage 1 Preindustrial Stage 2 Transitional Stage 3 Industrial Stage 4 Postindustrial High 80 70 Birth rate 60 50 Birth rate and death rate(number per 1,000 per year) Relative population size 40 30 Death rate 20 10 Total population 0 Low Low Increasing Very high Decreasing Low Zero Negative Growth rate over time Fig. 7-11, p. 137
10. Population Calcs. • Doubling time = 70/growth rate • Present pop = 7 billion, 1.2 % growth • 70/1.2 = 58 years doubling time • Population in 218x= 3 doubling times • 56 billion in 218x
11. Apesland • 55 birth, 30 death • A) % growth = 55-30 = 25/1000 = 2.5% • B) 70/2.5 = 28 yrs • C) Transitional • D) Like Mexico – improving health, cultural traditions still exist • E) Prediction is probably too high as growth rate likely to decrease.
12. • STUDY!
Questions 12-15 (Spring) • Draw a simple outline/map the USA. Locate and label the top 6 hotspots on the map. Explain what a hotspot is. Also name and draw in the range of 2 major invasive species. • Diagram the major steps in wastewater treatment. Include and label: primary, secondary, tertiary, mechanical, biological, chemical. • Draw an oxygen sag curve for a stream exposed to pollution from oxygen demanding wastes. Label each of the zones. • Draw and label a dose response curve that illustrates a non-threshold effect. Label the LD50. • List (in order) the world’s 7 most deadly infectious diseases. Identify the pathogen associated with each. • Calculate the yearly energy use in kWh of a gasoline-powered car that gets 20 mpg and travels 10,000 miles per year. A gallon of gasoline is equivalent to about 30 kWh. If an electric car requires about 30 kWh to go 100 miles, how far could it go in a year on the same amount of energy? How much more efficient is the electric car than the gasoline car (answer in percentage form). Show your work, box your answers and do not use a calculator. • Draw a diagram that illustrates the greenhouse effect. Label each of the following: visible light, heat, earth’s surface, troposphere, greenhouse gasses, infrared radiation (heat), and stratosphere. Add to the diagram at least 3 positive feedback loops that can occur in response to global warming. Distinguish between a positive feedback loop and a negative feedback loop. • Diagram the process of ocean acidification. Describe the connection between greenhouse gases, global warming and ocean acidification. • Diagram the process of ozone depletion and its effects. Label: CFCs, stratosphere, ultraviolet radiation, biological damage. Also find a way to depict the role of the Montreal Protocol. • Identify the 4 environmental laws that you think are most important. Explain your reasoning. • Create a table with the following 6 column headings: food production, water use, material goods, air quality, energy use, waste. In each column, list at least 5 significant and relevant solutions to environmental problems associated with the column heading. • Choose an important ecosystem service from your Semester 1 Key Concept Review. Create a diagram that clearly shows the role this service plays in supporting the ecosystem and humans. Label the important aspects of your diagram. • Beginning with Chapter 1, turn through the pages and review the major diagrams. Summarize in your mind the main points of each of the graphics. No written response required.
14. Mechanical Biological
15. Normal clean water organisms (trout, perch, bass, mayfly, stonefly) Trash fish (carp, gar, leeches) Fish absent, fungi, sludge worms, bacteria (anaerobic) Trash fish (carp, gar, leeches) Normal clean water organisms (trout, perch, bass, mayfly, stonefly) 8 ppm Types of organisms 8 ppm Dissolved oxygen (ppm) Biological oxygen demand Clean Zone Recovery Zone Septic Zone Decomposition Zone Clean Zone Fig. 11-24, p. 256
17 • 1) Pneumonia and flu • 2) HIV • 3) Malaria • 4) Diarrheal diseases • 5) TB • 6) Hep B • 7) Measels
18. Car Calculations • 10,000 mi ÷ 20 mpg = 500 gal of gas • 500 gal x 30 kWh/gal = 15,000 kWh • 15,000 kWh x 100 mi/30 kWh = 50,000 mi • The electric car is 500% as efficient as the gasoline car.
22 • ESA 1973 • Clean Air Act 1970 • Clean Water Act 1972 • Montreal Protocol 1987 • Kyoto Protocol 1997 • Superfund Law 1980 • RCRA 1976
23 (This is not a comprehensive list)
25 • STUDY!