Download
1 / 1
10 likes | 157 Views
CMOS 2005 - An educational tool to estimate how much air urban processes use locally (#675) Lewis Poulin, CMC, email: lewis.poulin@ec.gc.ca. Objectives Model & estimate volumes of air used by various urban processes Compare these volume estimates against volumes humans need per day Method

E N D
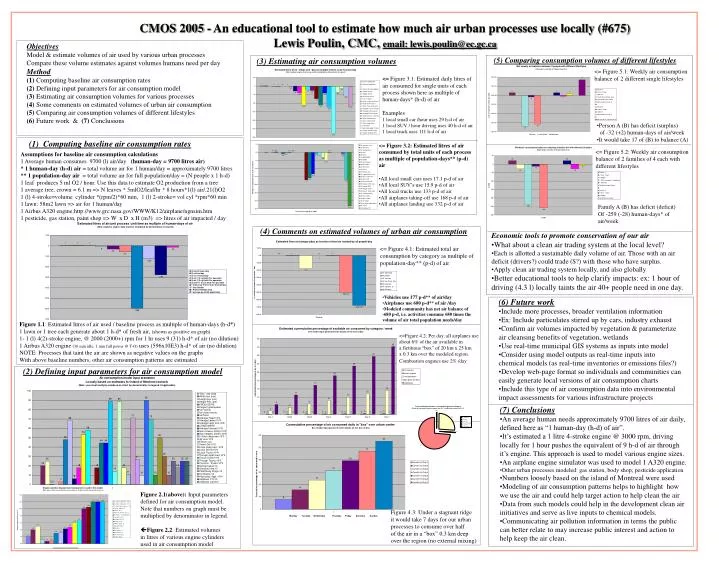
CMOS 2005 - An educational tool to estimate how much air urban processes use locally (#675) Lewis Poulin, CMC, email: lewis.poulin@ec.gc.ca Objectives Model & estimate volumes of air used by various urban processes Compare these volume estimates against volumes humans need per day Method (1) Computing baseline air consumption rates (2) Defining input parameters for air consumption model (3) Estimating air consumption volumes for various processes (4) Some comments on estimated volumes of urban air consumption (5) Comparing air consumption volumes of different lifestyles (6) Future work & (7) Conclusions (5)Comparing consumption volumes of different lifestyles (3) Estimating air consumption volumes <= Figure 5.1: Weekly air consumption balance of 2 different single lifestyles <= Figure 3.1: Estimated daily litres of air consumed for single units of each process shown here as multiple of human-days* (h-d) of air Examples 1 local small car /hour uses 29 h-d of air 1 local SUV / hour driving uses 40 h-d of air 1 local truck uses 111 h-d of air • Person A (B) has deficit (surplus) • of -32 (+2) human-days of air/week • It would take 17 of (B) to balance (A) (1) Computing baseline air consumption rates • <=Figure 3.2: Estimated litres of air • consumed by total units of each process as multiple of population-days** (p-d) air • All local small cars uses 17.1 p-d of air • All local SUV’s use 15.9 p-d of air • All local trucks use 133 p-d of air • All airplanes taking-off use 168 p-d of air • All airplanes landing use 332 p-d of air <= Figure 5.2: Weekly air consumption balance of 2 families of 4 each with different lifestyles Assumptions for baseline air consumption calculations 1 Average human consumes 9700 (l) air/day (human-day = 9700 litres air) * 1 human-day (h-d) air = total volume air for 1 human/day = approximately 9700 litres ** 1 population-day air = total volume air for full population/day = (N people x 1 h-d) 1 leaf produces 5 ml O2 / hour. Use this data to estimate O2 production from a tree 1 average tree, crown = 6.1 m => N leaves * 5mlO2/leaf/hr * 8 hours*1(l) air/.21(l)O2 1 (l) 4-stroke=volume cylinder *(rpm/2)*60 min, 1 (l) 2-stroke= vol cyl *rpm*60 min 1 lawn: 58m2 lawn => air for 1 human/day 1 Airbus A320 engine:http://www.grc.nasa.gov/WWW/K12/airplane/ngnsim.htm 1 pesticide, gas station, paint shop => W x D x H (m3) => litres of air impacted / day Family A (B) has deficit (deficit) Of -259 (-28) human-days* of air/week (4) Comments on estimated volumes of urban air consumption • Economic tools to promote conservation of our air • What about a clean air trading system at the local level? • Each is allotted a sustainable daily volume of air. Those with an air deficit (drivers?) could trade ($?) with those who have surplus. • Apply clean air trading system locally, and also globally • Better educational tools to help clarify impacts: ex: 1 hour of driving (4.3 l) locally taints the air 40+ people need in one day. <= Figure 4.1: Estimated total air consumption by category as multiple of population-day** (p-d) of air • Vehicles use 177 p-d** of air/day • Airplanes use 680 p-d** of air /day • Modeled community has net air balance of -680 p-d, i.e. activities consume 680 times the volume of air total population needs/day • (6) Future work • Include more processes, broader ventilation information • Ex: Include particulates stirred up by cars, industry exhaust • Confirm air volumes impacted by vegetation & parameterize air cleansing benefits of vegetation, wetlands • Use real-time municipal GIS systems as inputs into model • Consider using model outputs as real-time inputs into chemical models (as real-time inventories or emissions files?) • Develop web-page format so individuals and communities can easily generate local versions of air consumption charts • Include this type of air consumption data into environmental impact assessments for various infrastructure projects Figure 1.1: Estimated litres of air used / baseline process as multiple of human-days (h-d*) 1 lawn or 1 tree each generate about 1 h-d* of fresh air, (shown as positive on graph) 1- 1 (l) 4(2)-stroke engine, @ 2000 (2000+) rpm for 1 hr uses 9 (31) h-d* of air (no dilution) 1 Airbus A320 engine (30 min idle, 1 min full power @ T-O) uses (596x10E3) h-d* of air (no dilution) NOTE: Processes that taint the air are shown as negative values on the graphs With above baseline numbers, other air consumption patterns are estimated <=Figure 4.2: Per day, all airplanes use about 6% of the air available in a fictitious “box” of 20 km x 25 km x 0.3 km over the modeled region. Combustion engines use 2% /day (2) Defining input parameters for air consumption model • (7) Conclusions • An average human needs approximately 9700 litres of air daily, defined here as “1 human-day (h-d) of air”. • It’s estimated a 1 litre 4-stroke engine @ 3000 rpm, driving locally for 1 hour pushes the equivalent of 9 h-d of air through it’s engine. This approach is used to model various engine sizes. • An airplane engine simulator was used to model 1 A320 engine. • Other urban processes modeled: gas station, body shop, pesticide application • Numbers loosely based on the island of Montreal were used • Modeling of air consumption patterns helps to highlight how we use the air and could help target action to help clean the air • Data from such models could help in the development clean air initiatives and serve as live inputs to chemical models. • Communicating air pollution information in terms the public can better relate to may increase public interest and action to help keep the air clean. Figure 2.1(above): Input parameters defined for air consumption model. Note that numbers on graph must be multiplied by denominator in legend. Figure 2.2: Estimated volumes in litres of various engine cylinders used in air consumption model Figure 4.3: Under a stagnant ridge it would take 7 days for our urban processes to consume over half of the air in a “box” 0.3 km deep over the region (no external mixing)