Download
1 / 29
340 likes | 957 Views
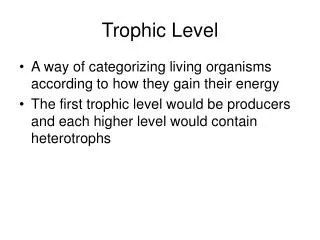
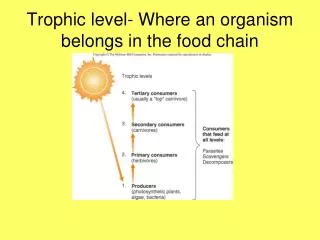
Trophic level of commercial groundfish catch: are we fishing down the food web in the Gulf of Alaska?. Jennifer M. Marsh M.S. Fisheries Student School of Fisheries and Ocean Sciences University of Alaska Fairbanks. Trophic Pyramid. 5 Apex Predators .

E N D
Trophiclevel of commercial groundfish catch: are we fishing down the food web in the Gulf of Alaska? Jennifer M. Marsh M.S. Fisheries Student School of Fisheries and Ocean Sciences University of Alaska Fairbanks
Trophic Pyramid 5Apex Predators • Primary producers: trophic level 1 • Primary consumers: trophic level 2 • (…) • Food webs are more complex • Omnivory • Ontogenetic diet change 4 Tertiary Consumers 3Secondary Consumers 2 Primary Consumers 1Primary Producers
TrophicLevel of Catch • Trophiclevel (TL) estimates of commercial fishery catches are used as an ecosystem-based indicator for sustainability. • Fishing down the food web (Pauly et al. 1998) • Fishing through the food web (Essington et al. 2006) • TL based on mass-balance models and gut content analysis • Single TL for species • No seasonal feeding dynamics and average length of catch for each species • Stable isotope analysis to estimate TL
Overall Goal Provide high resolution baseline information on the trophic status of the four most abundant groundfishes (arrowtooth flounder, pollock, cod, and halibut) in the GOA Objectives • Examine seasonal, annual and size-class variation of trophic role (d13C & d15N) for each species; and to • Estimate trophic level of commercial removals and biomass for each species in the GOA.
Stable isotope analysis • Gut content analysis provides only a snapshot of diet • SIA integrates assimilated food over time • Isotope values are presented in delta notation: • δ15N has a consistent enrichment of 3.4‰ from prey to consumer • δ15N can be used to assess trophic level where X is 15N or 13C, R is the ratio of heavy to light isotope (15N:14N or 13C:12C)
Methods: Collection • Fish were sampled in four seasons, 2000-2004, off northeast side of Kodiak Island.
Chapter 2: Analyses • Data transformations • Fitting ANCOVA models • Response variable: Trophic level • Covariate: length • Categorical variables: years • Evaluate ANCOVAs using AIC • Estimate trophic level using best fit models • Catch (Area 630) • Biomass (Area 630)
ANCOVA: Full Model Where: μ is the average trophic level Ai is the year effect (i = 1 to 5 years) Xijis the covariate (length) measured for observation Yij(trophic level) Xbar is the average value of the covariate for treatment group i βiis the slope term for length (covariate) εijis the error term
TL = 5 TL = 3
TL = 5 TL = 3
Estimated TL of commercial catch Based on length distributions of observer catch data and total catch numbers from area 630 63 64 61 62 59 48 48 50 43 43
Estimated TL of commercial catch Based on length distributions of observer catch data and total catch numbers from area 630 72 65 50 64 48 49 50 67 47 ( ) 68
Estimated TL of commercial catch Based on length distributions of observer catch data and total catch numbers from area 630
Estimated TL of fish populations Based on NMFS trawl survey estimates of size composition of fish populations from area 630
Population estimates: Area 630 Based on NMFS trawl survey estimates of size composition of population abundance from area 630
Summary • Pollock lowest TL, cod highest TL : • commercial catch • NMFS trawl survey • Drop in TL of commercial catch in 2003 for Pacific cod, arrowtooth flounder and Pacific halibut • TL of fish populations fluctuates after the mid 1990s for pollock and cod
Conclusions • Are we fishing down the food web? • Estimated TL of commercial catch remained steady • Only represents a fraction of the catch (higher TL predatory groundfish) • Continued monitoring is suggested • Advantages of stable isotope analysis • Allows TL to co-vary with length • Averages diet over a longer period of time • Provides a TL range for each species
Acknowledgements • Rasmuson Fisheries Research Center (RFRC) • Gulf Apex Predator prey study (NOAA Fisheries) • Advisors and committee: Robert J. Foy, Nicola Hillgruber, Matthew Wooller, Gordon Kruse • Alaska Stable Isotope Facility: Norma Haubenstock & Tim Howe • Alexander Andrews, Lei Guo, Franz Mueter • School of Fisheries and Ocean Sciences
Baseline Correction • Where: • TLi is the trophic level of organism i, • d15Ni is the measured d15N value for organism i, d15Nref is the measured d15N value for the baseline organism and • TLref is the TL of the baseline organism • Baseline organism = EULACHON • assigned a trophic 3.52 based on GOA Ecopath models (Aydin et al. 2007)
Walleye pollock • Percent weight of prey items • Weighted average of 1999 & 2001 • Stomachs analyzed: 1263 • Length range: 7 – 75 cm • Average length: ≈ 38 ± 5.5 cm Data from: Food Habits of Groundfishes in the GOA in 1999 and 2000. Yang et al. (2006)
Pacific cod • Percent weight of prey items • Stomachs analyzed: 1256 • Length range: 9 – 104 cm • Average length: ≈ 52 ± 5 cm
Arrowtooth flounder • Percent weight of prey items • Stomachs analyzed: 1858 • Length range: 9 – 81 cm • Average length: ≈ 39 ± 5 cm
Pacific halibut • Percent weight of prey items • Stomachs analyzed: 942 • Length range: 13 – 126 cm • Average length: ≈ 59 ± 7 cm