Download
1 / 14
140 likes | 217 Views
Global Monitoring, Carbon Cycle Science, and Emission Verification. James H. Butler with Pieter Tans, Colm Sweeney, Arlyn Andrews, John B. Miller NOAA Earth System Research Laboratory 28 September 2010. A challenge for the U.S. and the world. 2.

E N D
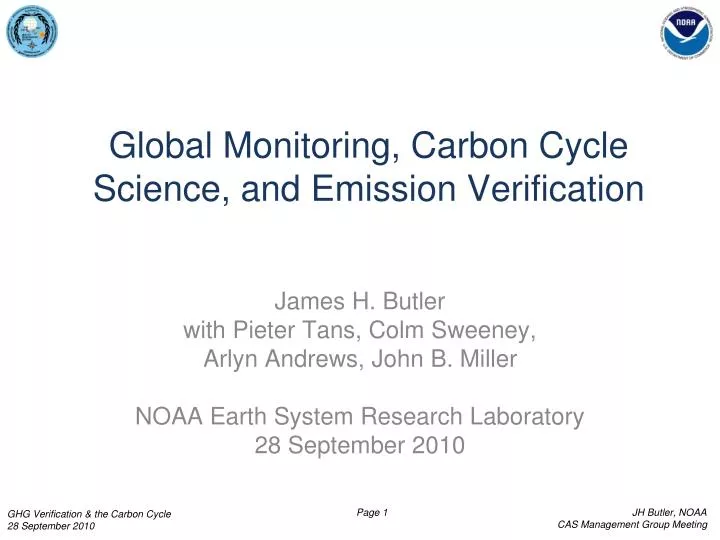
Global Monitoring, Carbon Cycle Science, and Emission Verification James H. Butler with Pieter Tans, Colm Sweeney, Arlyn Andrews, John B. Miller NOAA Earth System Research Laboratory 28 September 2010
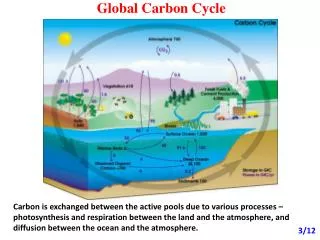
A challenge for the U.S. and the world 2 • Global society is advancing efforts to reduce CO2 emissions now – in the U.S., voluntary efforts are underway and some regulatory efforts are in place • Mitigation efforts will vary by nation, region, & emission sector (energy, industry, etc.), and will be diverse in their approach • The complexity & variability of the carbon cycle, the scale of problem, and the number of GHGs are challenging, but surmountable • Large-scale emission reduction approaches (e.g., international, national, state) require independent, scientific monitoring to support verification and policy decisions • Stratospheric Ozone • Air Quality, Acid Rain, et al.
How will Society Reduce Greenhouse Gas Emissions?? We don’t know . . . but . . 100 Enhance System Maintain System Develop System Establish Baselines Percent of 2010 Emissions Critical Verif ication Period 50 Fine Grid, Robust Verification 20 Time 2010 2020 2050 2100
Carbon Crucible – The Future Demands New and Expanded Approaches Increased Observations Improved Transport Models Enhanced Reanalysis
Surface-based Networks NOAA CarboEurope TCCON AGAGE WMO Global Atmospheric Watch FluxNet
Data sets & Visual displays (variable) Global trends (monthly) Globalview, (annual) Products Services DATA Interactive Data Visualization (daily) Greenhouse Gas Index (annual) CarbonTracker (annual)
Tall Tower Measurements • 1000-1500 ft high • “Continuous” sampling at 3-6 levels • Additional flask samples for ~50 tracers
Intake: 11m 30m 76m 122m 244m 396m Quantitative signatures of biological CO2 uptake and release LEF: July 2007 Park Falls, WI, July Large diurnal cycle at lowest levels results from combination of nighttime respiration and shallow boundary layers.
Atmospheric Vertical Profiles tropopause ground
In-situ Measurements Help Understand Remote Signals AirCore profile AirCore mean AIRS retrieval OCO retrieval FTS retrieval
Data Integration Products CO2 and Other GHGs Atmospheric Measurements “Land” exchange Oceanic Measurements Emission Inventories Surface Based Aircraft Satellite Mapping Satellite Biosphere Inventories & Fluxes Deep Ocean Surface Ocean
Summary • A comprehensive GHG information system is needed to inform policy and strategies of GHG emissions. • Such a system includes increased observations, higher resolution modeling, and ensemble analysis. Observations include in situ and remotely sensed data. • Surface and airborne measurements are useful, and in some cases essential, to • Provide reliable, accurate global trends and distributions • Understand trends in biospheric contributions • Improve inventories, especially of gases with biospheric interactions • Interpret and understand satellite retrievals • Separate biospheric from fossil fuel contributions • Attribute emissions reductions to sectors of the economy • Improve transport modeling
Questions? “Carbon Weather” January (net CO2emission) CarbonTracker™ Long-term Observations July (net CO2 uptake)