Download
1 / 12
120 likes | 240 Views
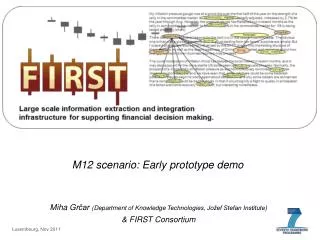
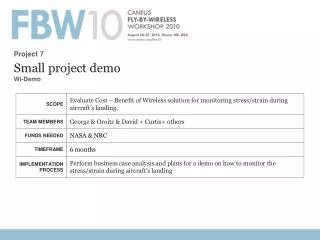
WSN Summer Project Demo Scenario. <Draft version 2008-07-14> Skövde 2008. Shows features (legend). Real-time (RT) Fusion (Fus) Database, Replication (DB) Scalability, ViFuR (VF). Fire fighting scenario or Battlefield game?.

E N D
WSN Summer Project Demo Scenario <Draft version 2008-07-14> Skövde 2008
Shows features (legend) • Real-time (RT) • Fusion (Fus) • Database, Replication (DB) • Scalability, ViFuR (VF)
Fire fighting scenario or Battlefield game? • The scenario described can be mapped to alternative real scenarios – ”imagine!”
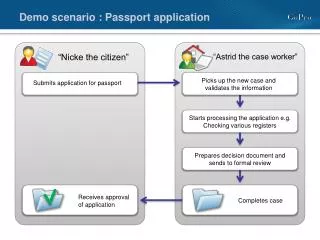
Scenario features • Items (people/vehicles etc) are moving over a field. They reveal signatures by (light) sensors that are spread out over the field. Their locations are reported into a database, from where their tracks can be extracted and also predicted by using fusion (e.g. Kalman filters). • Items are reported, with signatures and timestmaps, to the connected database node. • Disjoint sensor sub nets report their area to separate database nodes. Tracking and event localization is done at a (or several) fusion node(s), where database replication provides data for the entire area. • Tracks and actions are visualized at multiple client nodes, which have replicas of the visualization data (segment) of the database.
Features of the Scenario • Sensors: Tracking by using features, event detection and localization • Events are localized and uses certainty management, combines multiple sensors (RT, Fus) • Sensors classifies into signatures. This emulates processing for signatures at the sensor (RT, Fus) • Tracks + localized events are visualized on multiple displays (DB, Rep) • Tracking by using the logged visual trace, short term database time series, items may be distinguished by their physical move limitations (DB, Fus) • In the multi-tier architecture, sensors are arranged into subnets, each connected to a (single) database node. Data from a database node, representing sensors in the subnet are replicated to other database nodes as client needs arise. (VF, DB)
Sensor setup • Visual: Multiple TelosB, using the light sensors. • Optional: (Acoustic: Room has 5 MICAz+MTS310, using the microphone sound level)
Sensor placement L L L L L L L L L L L L L L L L L = Light sensor, on a projector screen
Technical needs • Move-events + classification from sensors • Action-events + signature from sensors • Feed of sensor data + (re-)configuration. Support request for 1) - single sensor input 2) - periodic sensor input 3) - sensor input (single or periodic) in response to event (including timer), all sensor input includes a vector of all sensor readings in the sensor node (should we prepare for the possibility of requesting a subset, or adding additional sensors?)(should we prepare for the need to buffer multiple readings and send as single message to save bandwidth clutter?) • Database replication, single master, but extendable for PRiDe
Impl:Mote communication • Tmote Connect approach • [ TelosB gateway Tablet USB ] • [ Tinymote gateway Tablet SD slot ] • [ Bluetooth gateway Tablet (port?) ]
Impl:Database • Store sensor data in local BDB database • Visualize sensor data • Replicate sensor data to other nodes • Visualization sensor data at other DB node
Visualization (1) • Raw indications L L L L L L L L L L L L L L L L = Intensity of light, color for certainty of indication
Visualization (2) 30% • Trace (and prediction) 50% 80% 100% 70% ”certainty%” = Fused localization (intensity of light/certainty of indication) = Prediction (by Kalman filter?)