Download

1 / 72
720 likes | 743 Views
Gain insights from Dr. Grier P. Page's expertise on the critical factors of metabolomics experimental design, including error management and statistical analyses. Learn about the importance of asking biological questions, experimental replication, and controlling non-biological variability. Discover techniques like randomization and orthogonalization to enhance study validity. Explore sample size estimation, classification methods, and considerations for technology advancements in metabolomics studies. Enhance your understanding of statistical assumptions and data quality checks for reliable outcomes.

E N D
Designing a high quality metabolomics experiment Grier P Page Ph.D.Senior Statistical Geneticist RTI International Atlanta Office gpage@rti.org 770-407-4907
UMSA Analysis Day 1 Day 2 Insulin Resistant Insulin Sensitive
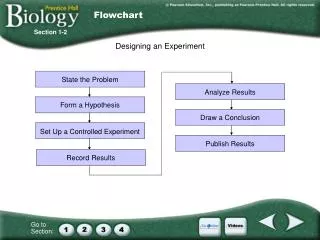
Primary consideration of good experimental design • Understand the strengths and weaknesses of each step of the experiments. • Take these strengths and weaknesses into account in your design.
The Myth That Metabolomics does not need a Hypothesis • There always needs to be a biological question in the experiment. If there is not even a question don’t bother. • The question could be nebulous: What happens to the metabolome of this tissue when I apply Drug A. • The purpose of the question is to drive the experimental design. • Make sure the samples answer the question: Cause vs. effect.
Design Issues • Known sources of non-biological error (not exhaustive) that must be addressed • Technician / post-doc • Reagent lot • Temperature • Protocol • Date • Location • Cage/ Field positions
Biological replication is essential. • Two types of replication • Biological replication – samples from different individuals are analyzed • Technical replication – same sample measured repeatedly • Technical replicates allow only the effects of measurement variability to be estimated and reduced, whereas biological replicates allow this to be done for both measurement variability and biological differences between cases. Almost all experiments that use statistical inference require biological replication.
How many replicates? • Controlled experiments – cell lines, mice, rats 8-12 per group. • Human studies – discovery 20+ per group • For predictive models – 100+ per group, need model building and validation sets • The more the better, always.
Experimental Conduct All experiments are subject to non-biological variability that can confound any study
Control Everything! • Know what you are doing • Practice! • Practice!
What if you can’t control or make all things uniform • Randomize • Orthogonalize
What are Orthogonalization and Randomization ? • Orthogonalization- spreading the biological sources of error evenly across the non-biological sources of error. • Maximally powerful for known sources of error. • Randomization – spear the biological sources of error at random across the non-biological sources of error. • Useful for controlling for unknown sources of error
Examples of Orthogonalization and Randomization ? Randomize The experiment Orthogonalize
Statistical analyses • Supervised analyses – linear models etc • Assume IID (independently identically distibuted) • Normality • Sometimes can rely on central limit • ‘Weird’ variances • Using fold change alone as a statistic alone is not valid. • ‘Shrinkage’ and or use of Bayes can be a good thing. • False-discovery rate is a good alternative to conventional multiple-testing approaches. • Pathway testing is desirable.
Classification • Supervised classification • Supervised-classification procedures require independent cross-validation. • See MAQC-II recommendations Nat Biotechnol. 2010 August ; 28(8): 827–838. doi:10.1038/nbt.1665. • Wholly separate model building and validation stages. Can be 3 stage with multiple models tested • Unsupervised classification • Unsupervised classification should be validated using resampling-based procedures.
Unsupervised classification - continued • Unsupervised analysis methods • Cluster analysis • Principle components • Separability analysis • All have assumptions and input parameters and changing them results in very different answers
There is strength in numbers —power and sample size . • Unsupervised analyses • Principal components, clustering, heat maps and variants • These are actually data transformations or data display rather than hypothesis testing, thus unclear if sample size estimation is appropriate or even possible. • Stability of clustering may be appropriate to think about. Garge et al 2005 suggested 50+ samples for any stability.
Sample size in supervised experiments • Supervised analyses • Linear models and variants • Methods are still evolving, but we suggest the approach we developed for microarrays may be appropriate for metabolomics (being evaluated)
Metabolomics does not reveal everything and different technologies show different things
Metabolite quality • Still evolving field • RTI is one of the Metabolomics Reference Standards Synthesis Centers